
Wurtsmith AFB: from contaminated soil to aquifer to stream
Can a coupled watershed model reconstruct fifty years of PFAS migration from nothing but public data — measured soil concentrations, public well logs, and open hydrology? Wurtsmith Air Force Base (Oscoda, Michigan) is the test.
The demonstration at a glance
All results are from an uncalibrated coupled model, with no parameter fitting of any kind. A manuscript describing the method is in preparation; until it completes peer review, treat this page as a research demonstration, not a peer-reviewed result.
The enigma the model had to reproduce
Monitoring at legacy AFFF sites often finds a puzzle: the shallow water table is nearly clean, while the aquifer below carries a mature contaminant plume. If contamination came from the surface, how did it get underneath clean water?
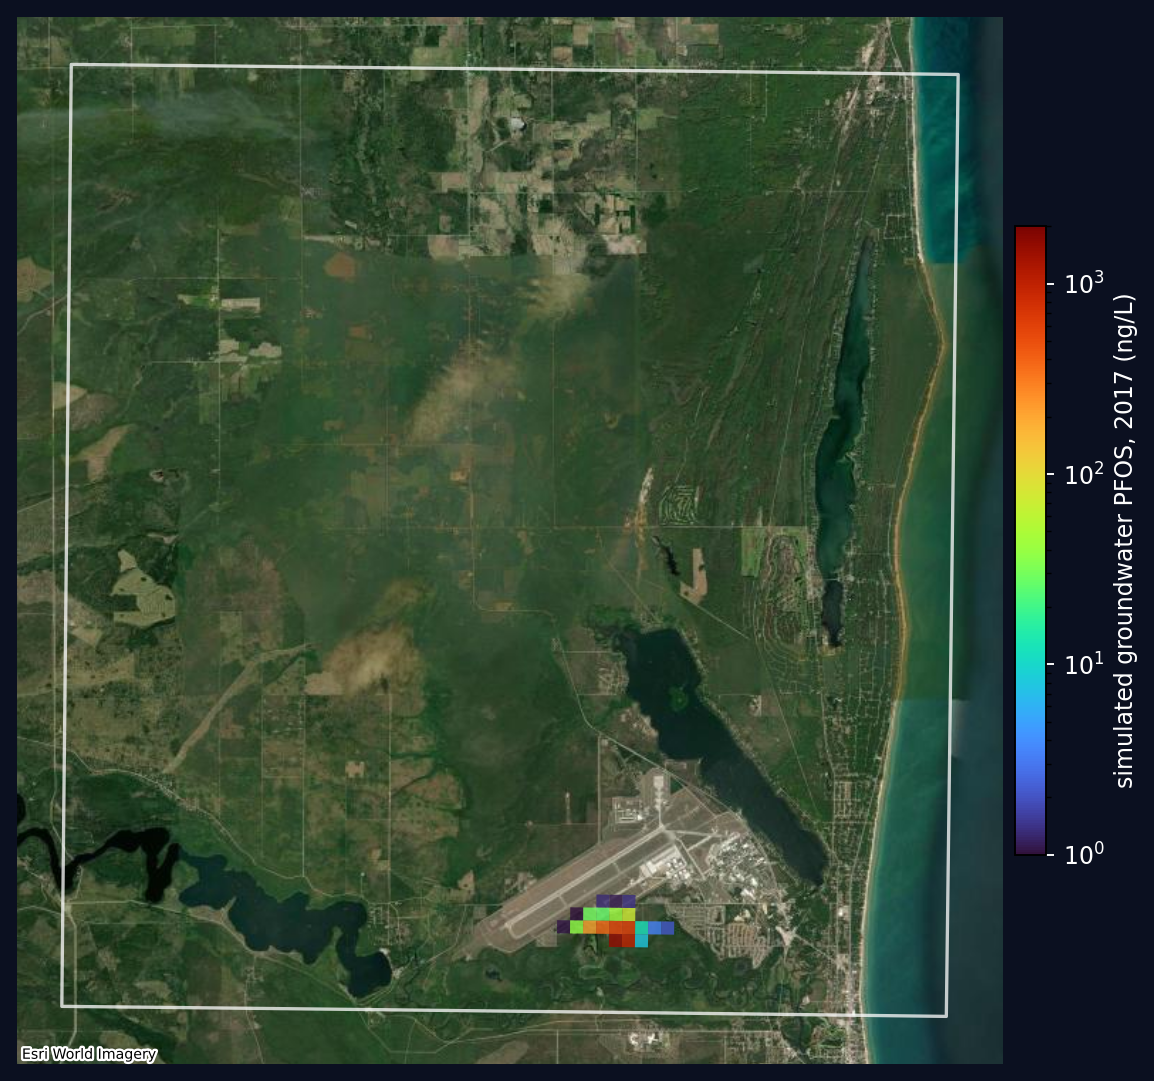
The answer is time. Decades of recharge slowly carried PFAS from fire-training-area soils down through the sandy vadose zone; the mass that reached groundwater kept sinking and migrating down-gradient while the source at the surface was excavated and controlled (~33 kg of PFOS removed at one fire-training area). By 2024, the plume core sits deep (~60 ft), the shallow water table has largely flushed — and a model that carries the full 1971–2024 history through soil, vadose zone, and aquifer reproduces that shape: simulated 2017 concentration at the plume core rises roughly 201× from the shallow layer to the deep layer (7.9 → 84.3 → 1,590 ng/L). A model initialized from today's surface alone would not reproduce that rise at all.
The shape is right; the magnitude at that deep core is not. The same 1,590 ng/L value is 3.7× the highest concentration observed at any validation well (1,590 vs 425 ng/L). Source: vadose_wurtsmith/validation_summary.json, the artifact the national analysis cites for the same figures.
Why the vadose zone decides the physics
Wurtsmith's water table sits ~3.5 m below the surface in sand — PFAS reaches groundwater in years, so soil, aquifer, and stream are dynamically connected within the simulation window, and explicit unsaturated-zone transport (MODFLOW 6 UZF/UZT driven by daily SWAT+ percolation) is the right physics. PFOS clings to soil grains and gathers where air meets water in the pores, so every metre of unsaturated soil above the water table slows it down. At Wurtsmith that layer is thin, which is why its plume reached groundwater within decades rather than being held back.
Built entirely from public data
Every input is public: the watershed model comes from the same national pipeline as any SWATGenX model; the subsurface comes from the national groundwater lithology inventory (1,026 wells in this single HUC12); the source term comes from measured soil concentrations of the kind collected in the national soil PFAS inventory; and the groundwater validation dataset was extracted from public EGLE investigation reports. The coupling method is described on the SWAT+MODFLOW-6 page.
Page updated 2026-07-03. Results shown are an uncalibrated research demonstration; the accompanying manuscript is in preparation.