Automated U.S. watershed modeling
How SWATGenX builds SWAT+ watershed models
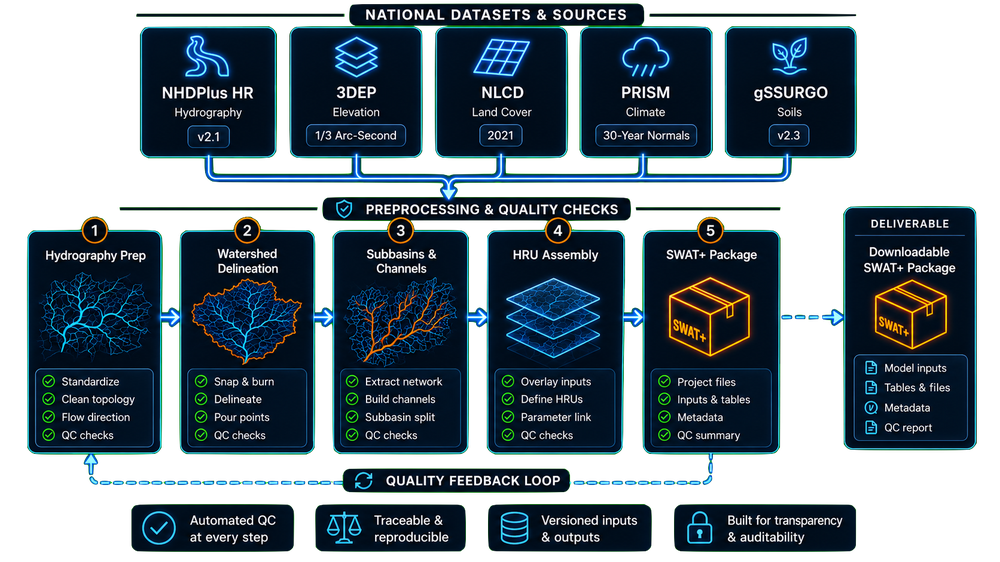
This is the SWAT+ model generation methodology behind SWATGenX: how NHDPlus-HR hydrography, national soils, land cover, and climate inputs, and QSWAT+ / SWAT+ Editor assembly turn a selected U.S. basin into a downloadable project package—with quality checks at every step.
- National datasets & standards
- Automated prep & QC pipeline
- Reproducible & transparent
- Built for accuracy at scale
Overview
SWATGenX is designed to automate the preparation of SWAT+ (SWAT Plus) watershed model packages for U.S. watersheds. A user-selected USGS gage, HUC12 outlet watershed, HUC8 basin, or hand-picked HUC14 single-catchment set is converted into a model domain, then SWATGenX assembles hydrography, subbasins, channels, HRUs, weather, land cover, soils, crop, and water-use inputs into a downloadable SWAT+ project structure.
This page documents the methodology behind that process. It focuses on model-generation logic, data preprocessing, assumptions, quality checks, and known limitations. Supporting flood-screening reports are described separately because they are secondary outputs, not the core modeling product.
Watershed selection and model domain
SWATGenX supports four model-domain entry points:
- USGS gage workflow — the model domain is defined around a streamgage and its contributing watershed.
- HUC12 outlet workflow — the model domain is defined from a selected WBD HUC12 outlet watershed or catalog watershed.
- HUC8 workflow — the model domain is defined as a whole eight-digit hydrologic unit for larger basin-scale model preparation.
- HUC14 single-catchment workflow — drill inside a HUC12 in the Watershed Explorer and hand-pick individual NHDPlus-HR catchments (with recursive upstream selection); the model domain is delineated at fine resolution (30 m) for site-scale studies. This is how the coupled SWAT+/MODFLOW 6 site models (e.g. Wurtsmith AFB, Gabreski ANGB) are built.
After the domain is selected, SWATGenX clips and prepares the relevant hydrography, catchments, waterbodies, terrain, and input layers needed for SWAT+ model assembly.
Outlet definition in NHDPlus-HR models
SWATGenX does not use the traditional TauDEM/QSWAT+ workflow where a user manually places a single outlet point during delineation. In the NHDPlus-HR workflow, the stream network, catchments, hydrosequence attributes, and downstream routing relationships are already defined in the national hydrography product.
For USGS gage, HUC12 outlet, HUC8, and HUC14 single-catchment workflows, SWATGenX derives the model domain and routing structure from the NHDPlus-HR stream/catchment network. The basin outlet and internal routing are therefore defined by the processed NHDPlus-HR topology rather than by a manually selected outlet point.
For calibration, users can still select the appropriate channel or reach in the generated SWAT+ model and match observed discharge stations to the corresponding simulated channel output.
Hydrography preprocessing with NHDPlus-HR
NHDPlus-HR is used as the primary hydrography and routing backbone for SWATGenX model generation. The product provides high-resolution flowlines, catchments, waterbodies, value-added attributes, and WBD hydrologic-unit relationships that can be transformed into SWAT+ routing inputs.
Raw NHDPlus-HR data are not directly equivalent to a SWAT+ model network. SWATGenX preprocesses the hydrography to create a directed, connected, and SWAT+-compatible channel structure. Processing is applied consistently within each vector processing unit (VPU) before user-scale model extraction.
The steps below condense the full preprocessing narrative used for technical documentation; they align with the same logic described in the internal NHDPlus-HR–to–SWAT+ methods reference used for reproducibility and QA.
- Projection: vector features are projected to an appropriate UTM coordinate system so channel length and area calculations are metric.
- Second divergence: second-divergence reaches are removed or merged so ambiguous or circular routing paths are not carried into the working hydrosequence graph; catchment area is conserved where reaches are dropped.
- Consistency: flowlines are matched to NHDPlus catchments (NHDPlusID); coastal artificial or disconnected linework unsuitable for upland SWAT+ routing is removed; isolated segments after cleaning may be excluded from routing (with optional QA exports).
- Channel metrics: reach length and channel drop are derived from NHDPlus-HR geometry and smoothed elevation attributes, with units converted for SWAT+ compatibility.
- Flags: start and terminal flags are recomputed from the cleaned UpHydroSeq / DnHydroSeq graph.
- HUC8 / HUC12: catchment centroids are joined to WBD HU8 and HU12 for watershed organization attributes.
NHDPlus-HR workflow versus TauDEM fallback
SWATGenX primarily emphasizes NHDPlus-HR-based model generation because it preserves national high-resolution stream, catchment, waterbody, and routing information. In some cases, a TauDEM-based workflow may be used as a fallback or alternative delineation path.
The two workflows are not identical. TauDEM-style delineation depends on DEM-derived flow direction and outlet definition, while the NHDPlus-HR workflow relies on an existing national hydrography and catchment network. Users should check model metadata or the example-model catalog to confirm the delineation source used for a delivered package.
Subbasins, channels, catchments, and waterbodies
SWAT+ requires a consistent routing structure in which channels, subbasins, HRUs, and waterbodies can be linked through a valid downstream network. SWATGenX converts the preprocessed NHDPlus-HR graph into SWAT+-ready spatial units.
The workflow aggregates NHDPlus catchments into subbasin polygons, assigns channels to subbasins, enforces single-outlet behavior where needed, and links retained waterbodies to the channel network. Small or impractical subbasins may be merged downstream according to configured model-generation rules, followed by connectivity checks.
- Catchments are dissolved into SWAT+ subbasin polygons after final routing assignment.
- Multi-outlet groups are split or refined so the resulting subbasins follow SWAT+ routing assumptions (one outlet to another subbasin or the domain boundary).
- Waterbodies above a configured minimum area threshold are linked to the stream network.
- Inlet, outlet, and within-lake channel segments are classified for SWAT+ waterbody representation.
- Channel, lake, and subbasin identifiers are renumbered into contiguous model-ready indices.
Lake and reservoir representation
SWATGenX uses NHDPlus-HR waterbody polygons where available. Retained lakes and reservoirs are represented explicitly in the stream/lake routing network when they meet configured area and connectivity criteria. They are not represented only as WATR land-use HRUs.
The generated stream layer may include lake-related attributes such as lake inflow, lake outflow, within-lake stream segments, and primary lake outlet segments. These attributes help define how streams enter, pass through, or leave mapped waterbodies in the SWAT+ model structure.
Because SWAT+ requires simplified waterbody routing, complex lake systems, multi-outlet lakes, reservoirs with operational release rules, and connected wetland systems may require user review and project-specific refinement after download. Explicit reservoir operation schedules often need local operational data and should not be assumed from national products alone.
Terrain, land cover, soils, crops, and water-use preparation
After the hydrography and subbasin network are prepared, SWATGenX assembles the spatial inputs required for SWAT+ model setup. Terrain, land cover, soils, crop rotation, and water-use data are clipped or mapped to the selected model domain and converted into the formats expected by the SWAT+ setup pipeline.
These layers support HRU definition, watershed characterization, management inputs, and optional irrigation or water-use representation.
- Terrain inputs support slope, elevation, and routing-related model setup.
- NLCD land cover supports land-use assignment and HRU preparation.
- gSSURGO soils support soil physical properties used in SWAT+.
- NASS crop information supports crop rotation and agricultural management inputs where used in the pipeline.
- USGS water-use data support irrigation and water-use inputs where available.
HRU definition
SWATGenX creates HRUs from the intersection of land use, soil, and slope classes rather than using a single dominant land use/soil/slope combination for each subbasin.
The default slope classes used in the automated workflow are: 0–3%, 3–9%, and greater than 9%.
In the automated batch workflow, SWATGenX does not impose an additional minimum HRU area threshold by default. This preserves spatial detail but can produce a large number of HRUs in large watersheds, especially when NHDPlus-HR hydrography creates many subbasins and channels.
Weather and climate input preparation
SWAT+ models require continuous weather inputs. SWATGenX prepares weather time series from national gridded datasets and converts them into model-ready climate files. Precipitation and temperature are derived from Oregon State PRISM where used; solar radiation, humidity, and wind inputs may be derived from NSRDB or related national products depending on pipeline version and product configuration.
Exact variable sets, file formats, and station-to-grid mapping follow the operational pipeline for your build; confirm against run metadata packaged with your download.
SWAT+ project assembly and exported package
The processed hydrography, spatial layers, and climate inputs are assembled into a SWAT+ project structure. The delivered package is intended to provide a complete starting point for review, editing, calibration, validation, and further simulation in SWAT+ tools.
Pinned modeling software (hosted pipeline)
SWATGenX production workers use fixed releases of the official SWAT+ toolchain so packages are reproducible across basins and build dates:
- SWAT+ 2.3.1 (Linux installer) — hydrologic simulation executable.
- QSWAT+ 2.1.2 (
QSWATPlusLinux3_64QGIS plugin) — watershed delineation, HRU/landscape build, and TauDEM-class steps when those modes run in the assembly pipeline. - SWAT+ Editor 3.0.8 — project SQLite database, weather import, text I/O export, and simulation orchestration aligned with the delivered package.
The SWAT+ 2.3.1 binary may also report an internal build revision string (for example 61.0.2.x) in swatplus --version; that label refers to the same pinned Linux distribution, not a separate product version. National parameter databases installed alongside the stack follow the SWAT+ datasets bundle shipped with the installer (for example swatplus_datasets.sqlite from the 3.0.0 datasets release).
A typical SWATGenX package may include SWAT+ text inputs, SWAT+ Editor database files, watershed shapefiles, raster inputs, weather files, streamflow records where applicable, run metadata, and supporting documentation.
The package should be treated as an automatically generated model setup. Users may review, edit, calibrate, or extend the model depending on the purpose of the study.
Observed streamflow records
Where available, SWATGenX includes observed discharge records from USGS NWIS / Water Services to support model review and calibration. The discharge variable is USGS parameter 00060, daily mean streamflow.
The original USGS unit for parameter 00060 is cubic feet per second (cfs). Users should confirm unit handling when comparing observed discharge with SWAT+ simulated flow outputs during calibration.
The available date range depends on the model build, data availability, and pipeline version. Users should check the packaged run metadata and streamflow files for the exact period included in a delivered model.
- Initialization, calibration & validation describes CropScape rotation setup, USGS irrigation context, streamflow objectives, optimization workflow, and holdout verification used in the automated pipeline where applicable.
Quality assurance and known limitations
SWATGenX applies automated quality checks during model preparation. These checks are intended to identify topology, connectivity, input consistency, and export issues before a model package is delivered.
- Stream–catchment pairing between retained flowlines and catchment polygons.
- Connected downstream routing after divergence and isolated-reach handling.
- Single subbasin assignment for each retained reach and catchment.
- Valid lake or waterbody outlet representation where waterbodies are retained.
- Contiguous channel, lake, and subbasin identifiers in exported files.
- Presence and completeness of required climate and spatial inputs.
Calibration readiness
SWATGenX packages are automatically generated SWAT+ model setups. They are intended to provide a complete starting point for review, editing, calibration, and further simulation. They should not be interpreted as calibrated final models unless a separate calibration workflow has been completed.
Before calibration, users should review:
- Weather inputs and simulation period.
- Observed discharge files and station–channel matching.
- Selected outlet/channel reaches for calibration.
- Land use and management schedules.
- Plant communities and crop rotations.
- Reservoir/lake objects and routing.
- Irrigation and water-use assumptions.
- Point sources, fertilizer, grazing, and nutrient-management assumptions where water quality calibration is planned.
For streamflow calibration, it is often more practical to begin with a smaller upstream watershed, calibrate the main hydrologic parameters, and then use those parameter ranges as a starting point for larger HUC8-scale models.
For water quality calibration, hydrology should generally be calibrated first. Total nitrogen, total phosphorus, and sediment calibration require additional review of management, fertilizer, point-source, routing, and nutrient-cycling assumptions.
Known limitations:
- Automated models still require technical review before use in regulatory, design, or publication-grade studies.
- National datasets may contain local errors or inconsistencies that require manual correction.
- Waterbody routing and multi-outlet lake behavior are simplified relative to local hydraulic reality.
- Model performance depends on calibration, validation, and the quality of observed data.
- Management schedules, reservoir operations, irrigation rules, and local infrastructure may require project-specific refinement.
Computational implications of high-resolution hydrography
NHDPlus-HR preserves a much denser hydrographic network than simplified delineation workflows. This improves surface-water representation but also increases the number of channels, subbasins, lakes, and HRUs in large watersheds.
For full HUC8 basins, model packages may become large and simulation or calibration may require substantial computational resources. Users should consider starting calibration on smaller upstream watersheds before scaling to full-basin applications.
Supporting flood-screening and report methodology
SWATGenX can also generate supporting watershed reports and screening layers. These products are designed to provide rapid watershed context and are not the primary SWAT+ model-generation method.
For streamgage-based flood screening, annual peak streamflow records are retrieved from USGS where available. Return-period thresholds may be estimated using Log-Pearson Type III frequency analysis following the general structure of Bulletin 17C. Recent streamflow conditions can then be compared against those thresholds for screening-level context.
Rainfall context may be derived from PRISM daily precipitation grids by comparing recent precipitation against historical percentiles at the relevant grid cell. Those precipitation percentiles are not design-storm estimates and should not be interpreted as NOAA Atlas 14 intensities.
These report products are screening and documentation outputs. They are not FEMA flood maps, NFIP regulatory products, or substitutes for hydraulic modeling.
Data sources used by SWATGenX
The table below summarizes national datasets used or referenced by SWATGenX. Exact availability, versions, and processing details may vary by pipeline version and watershed location.
| Dataset | Steward | Native form / resolution | Role in SWATGenX | Citation / attribution |
|---|---|---|---|---|
| NHDPlus-HR | USGS NHDPlus HR | High-resolution vector hydrography, catchments, flowlines, waterbodies, value-added attributes; built from 1:24,000 NHD and 10 m 3DEP-related terrain per USGS documentation | Hydrography backbone, routing, catchments, subbasins, channels, waterbodies (hydrography preprocessing) | Cite USGS NHDPlus-HR product version and release used |
| WBD / HUC boundaries | USGS Watershed Boundary Dataset | Vector HUC polygons (official hierarchy per USGS) | HUC8/HUC12 organization and watershed selection | Cite WBD release used |
| PRISM | Oregon State PRISM Climate Group | Gridded climate (~4 km cells common); PRISM meteorological day ends 12:00 GMT — confirm in PRISM metadata for your extract | Precipitation and temperature for SWAT+ weather inputs; PRISM (Parameter-elevation Regressions on Independent Slopes Model) grids also support rainfall context in screening views where enabled | Follow OSU PRISM citation guidance |
| NSRDB | NREL National Solar Radiation Database | Gridded solar and related meteorology; spacing and cadence per NREL documentation for the product version in use | Solar, humidity, wind, and related climate drivers where used | Cite NREL + NSRDB version |
| NLCD | USGS MRLC / NLCD | 30 m national land cover (Landsat-based; nominal cell per MRLC) | Land cover for HRUs and reporting | MRLC data use and citation policy |
| gSSURGO | USDA NRCS gSSURGO | Gridded SSURGO; typical national grids ~10 m — verify against your snapshot | Soils for SWAT+ HRUs | USDA NRCS citation guidance |
| NASS QuickStats / Cropland Data Layer | USDA NASS | Tabular QuickStats and/or gridded CDL per NASS product documentation | Crop rotation and agricultural management inputs where used | USDA NASS citation guidance |
| USGS Water Use | USGS Water Use | County or water-use compilation products per USGS documentation | Irrigation and water-use context where available | USGS Water Use data citation |
| USGS NWIS / Water Services | USGS Water Services | IV, DV, peaks; discharge parameterCd 00060 — cadence per USGS transmission | Calibration support, streamflow context, flood screening inputs | USGS Water Data policies; provisional vs approved data disclaimers |
| EPA Water Quality Exchange (WQX / STORET) + USGS WQP | Water Quality Portal | Observed stream nutrients & sediment (nitrate, total P, ammonia, SSC); ~163,000 monitoring stations, in-channel samples 2000–2024 | Observed-data screening in the Watershed Explorer and water-quality calibration context (not part of the model package) | US public domain; mixed federal/state submitters via WQX |
| PFAS monitoring inventory (multi-source) | WQP + state programs (MI EGLE, CO CDPHE) | Measured PFAS in water (ng/L), sediment & fish tissue (µg/kg); ~8,500 stations, each point tagged with its source dataset | Contaminant screening overlay; classified against EPA 2024 PFAS MCLs | US public domain + state open-data licenses |
| NOAA MRMS (where shown) | NOAA MRMS | Multisensor radar–gauge products; resolution and latency per NOAA | Near-real-time precipitation context in map views where enabled | NOAA / NSSL usage terms |
Groundwater & PFAS modeling — SWAT+MODFLOW 6
Beyond the watershed model, SWATGenX builds coupled SWAT+/MODFLOW 6 groundwater models: a 3-D aquifer whose layers, hydraulic conductivity, and starting water table are kriged per-watershed from ~1.17 million state water-well records (currently Michigan Lower Peninsula), driven by the SWAT+ water balance and validated against observed well heads. The open SWATGenX engine additionally supports live daily two-way coupling (MODFLOW 6 embedded via its BMI/XMI interface) with PFAS fate and transport — Freundlich sorption and air–water interfacial partitioning in soils, advective–dispersive transport in the aquifer (GWT), and in-stream routing of groundwater discharge (SFT). This capability has been demonstrated at AFFF-impacted sites (Wurtsmith AFB and Gabreski ANGB site models; Rogue River validation, head NSE 0.91 against 5,383 measurements) and is described in a manuscript under peer review.
Scope, stated precisely: the hosted cloud-calibration workflow calibrates hydrology and streamflow only; PFAS simulation is a capability of the open coupled engine, run as a downstream study-specific workflow with site data and review. The Watershed Explorer's ~8,500-station PFAS monitoring inventory is a separate screening layer of measured concentrations — it shows where PFAS has been observed; the coupled engine is what simulates transport. See how the coupling works and the watershed-to-site PFAS demonstration with its interactive 3-D plume.
Citations and references
Use authoritative steward documentation for dataset versions in your study. The list below is illustrative, not exhaustive.
- Arnold, J. G., Srinivasan, R., Muttiah, R. S., and Williams, J. R. (1998). Large area hydrologic modeling and assessment. Part I: Model development. Journal of the American Water Resources Association, 34(1), 73–89.
- Bieger, K., Arnold, J. G., Rathjens, H., White, M. J., Bosch, D. D., Allen, P. M., Volk, M., and Srinivasan, R. (2017). Introduction to SWAT+, a completely restructured version of the Soil and Water Assessment Tool. Journal of the American Water Resources Association, 53(3), 598–608.
- USGS. NHDPlus High Resolution — product documentation: usgs.gov/national-hydrography/nhdplus-high-resolution
- USGS. Watershed Boundary Dataset: usgs.gov/national-hydrography/watershed-boundary-dataset
- England, J. F., Jr., et al. (2018). Guidelines for determining flood flow frequency—Bulletin 17C. USGS Techniques and Methods book 4, chap. B5 (doi:10.3133/tm4B5).
- PRISM Climate Group, Oregon State University. PRISM climate data and citation: prism.oregonstate.edu
- Homer, C., et al. NLCD collection documentation (cite the NLCD vintage used): mrlc.gov/data
- USDA NRCS. gSSURGO documentation: nrcs.usda.gov (gSSURGO)
- NREL. National Solar Radiation Database: nsrdb.nrel.gov
- USGS. Water Data for the Nation / NWIS services: waterdata.usgs.gov
Attribution for delivered packages
Cite underlying data stewards (USGS, PRISM, USDA NRCS, MRLC, NREL, NOAA as applicable) per each dataset’s citation guidance. Cite SWAT+ using Texas A&M / SWAT documentation appropriate to your version (hosted builds: SWAT+ 2.3.1, QSWAT+ 2.1.2, SWAT+ Editor 3.0.8 — see Pinned modeling software above). For SWATGenX-delivered packages, record the platform name, approximate run date, and watershed identifier (USGS site or HUC) so results can be reproduced.
Further technical articles
Deeper, page-length notes on setup pain points and automation tradeoffs (linked from SWAT+ model generation):
Related pages
- SWAT+ model generation — product overview
- How it works — end-user workflow
- Watershed modeling guide — definitions
- Watershed Explorer — interactive workspace
- Peace River HUC8 (Florida) case study — published SWAT+ walkthrough
- About SWATGenX — mission and team context
- Contact — product, API, and partnership inquiries