SWATGenXSWATGenX
Watershed ExplorerPricing
ServicesWatershed ExplorerExample modelsCloud calibrationDocsPricing

Watershed-to-site PFAS fate & transport modeling

Fifty years of an AFFF legacy at Wurtsmith AFB, reconstructed from a measured soil source term rather than a fitted flux — a 250 m watershed model that carries the reported transport, a 30 m site model that supplies the flow field, and explicit vadose-zone transport.

1
Pick a point
anywhere in CONUS
→
2
Watershed model
HUC12 · SWAT+/MODFLOW 6 · 250 m
→
3
Site model
HUC14 · nested · 30 m
→
4
Compare with wells
observed PFOS · 250 m transport

One pipeline, two scales

Plume-scale questions don't need the whole watershed, and watershed-scale hydrology can't resolve a plume. So we run both — the same automated pipeline, nested. The watershed model resolves regional flow and hands the site model its boundary conditions; the site model resolves the plume at 30 m. Every observation is validated at the scale that resolves it.

This is one nest, chosen for one site. Where to place the cut in general — at a gauge, a HUC12 outlet, or a single catchment — what can cross it, and the cases where nesting is physically indefensible are set out on nested watershed modeling; the site-scale build itself is described on site-scale (HUC14) modeling.

The pipeline is built on a two-way coupled SWAT+ / MODFLOW 6 simulation, and PFAS transport is native to every stage: land and soil in the SWAT+ engine, vadose zone via UZF/UZT, aquifer in MODFLOW 6 GWT, and streams in-engine. No WASP, RT3D, or third-party water-quality model is used anywhere in this workflow.

Watershed scale
HUC12 · 250 m
The 150 km² watershed model; the eight upstream Pine River HUC12s are left out. SWAT+ land-surface hydrology + a 3-layer MODFLOW 6 aquifer, kriged from 1,026 state well records. PFOS transport is reported from this model.
Site scale
HUC14 · 30 m
A 77 km² footprint re-centred on the observations: the catchments holding every monitoring well and surface-water station, rebuilt at 30 m. It sits beside the watershed model, not inside it, and supplies the flow field.
Vadose → aquifer
explicit UZF/UZT
PFAS travels land → unsaturated zone → water table → plume → stream in one MODFLOW 6 simulation. The shallow ~3.5 m sandy vadose zone is where explicit transport, not a screening shortcut, changes the answer.

Three sites, three depths to water

How thick the unsaturated zone is decides whether land-applied PFAS reaches groundwater within a management horizon at all — so it is the variable the three modeled sites were chosen to span. Wurtsmith sits at the shallow end, 3.5 m of sand, where the plume arrives in years rather than decades. The same framework carries to the intermediate and deep cases below without changing the method.
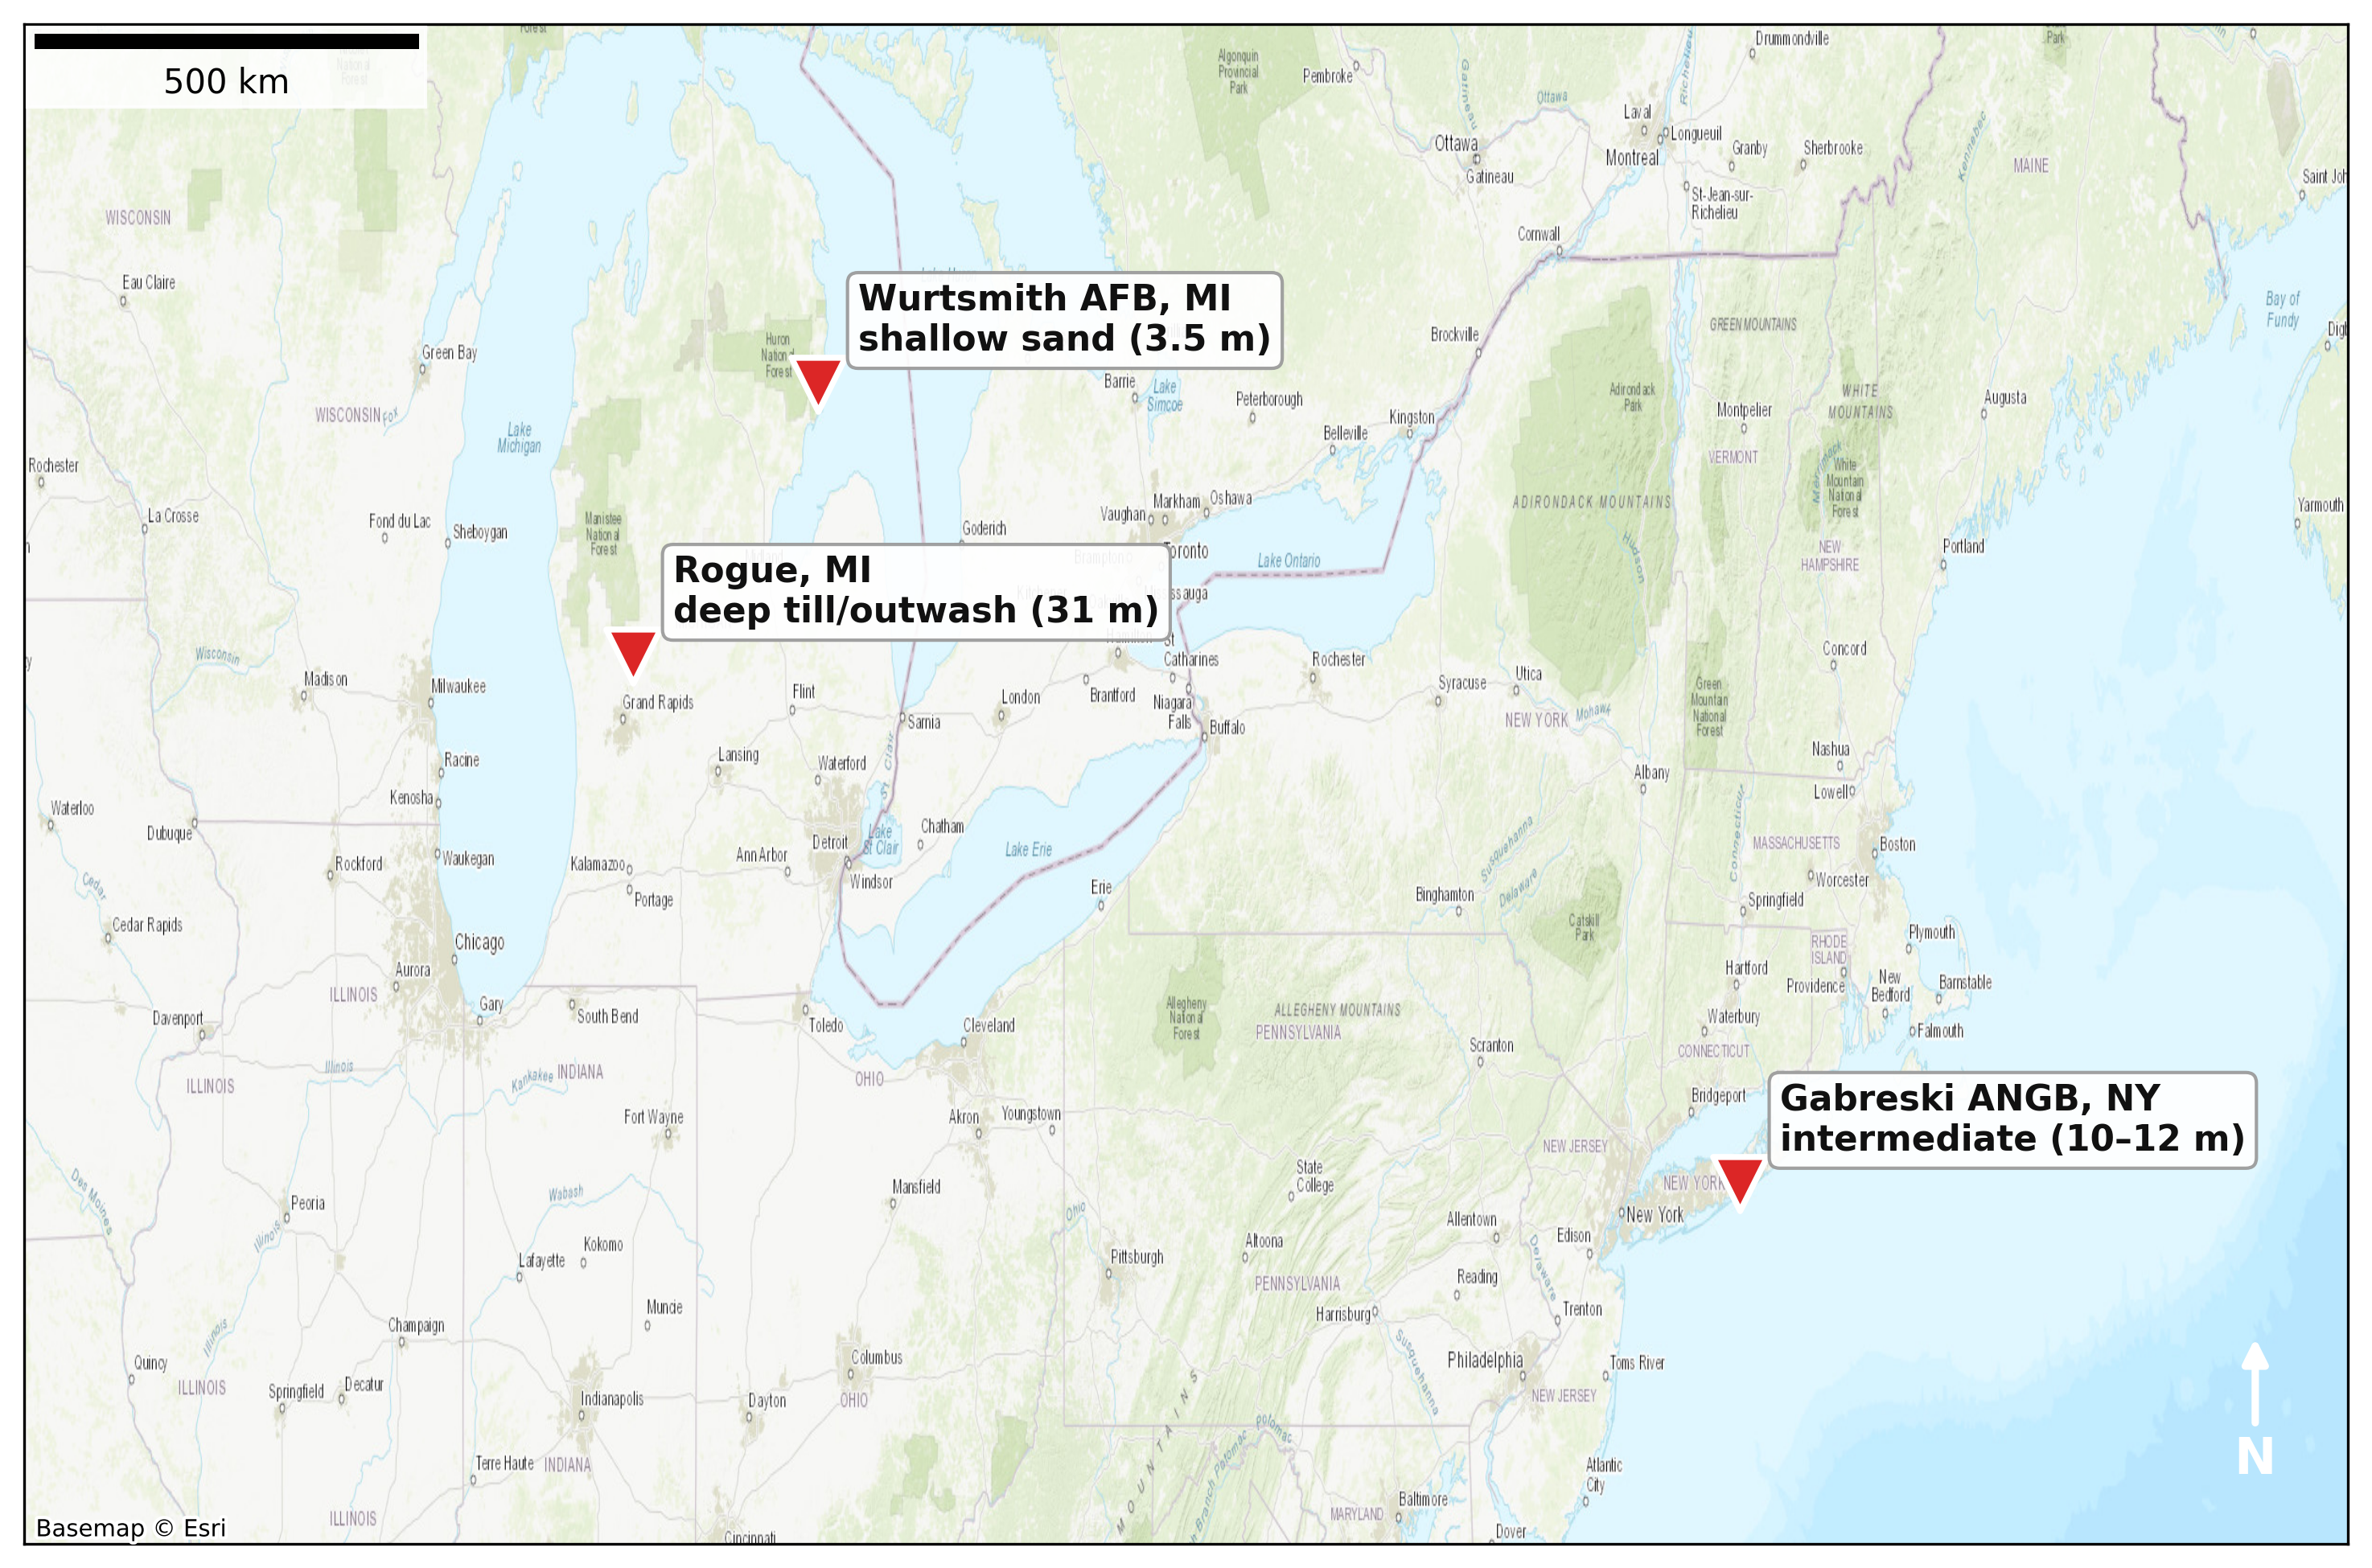
Four-panel study-area figure: a locator map of three modeled AFFF sites, then each site's watershed — Wurtsmith AFB in Michigan, Gabreski ANGB in New York, and the Stegman Creek site in Michigan — with PFAS source zones marked.
Three modeled AFFF sites spanning the vadose spectrum: (a) where they are, then each site’s watershed and source zones — Wurtsmith AFB, MI (3.5 m to water), Gabreski ANGB, NY (10–12 m), and Stegman Creek (Rogue), MI (source cells 0–26 m to water).

What stays fixed across the three sites. The claim above is that the method does not change between them — so here is the method that does not change.

Source term
Set from measurement, not fitted
Constant-concentration cells at source-zone grid cells whose measured groundwater PFOS exceeds 10⁴ ng L⁻¹, held at their observed concentration. There is no calibrated concentration multiplier. The only quantity fitted to in-stream observations is a single scalar — the fraction of the discharged load that reaches the stream.
Sorption
Freundlich, the PFAS-standard isotherm
K = 0.005, exponent n = 0.8 (MODFLOW 6 MST), giving concentration-dependent retardation rather than a single partition coefficient. A conservative-tracer run on the same flow field is the reference that shows the retardation is real.
Advection & dispersion
TVD, with stated dispersivity
Total-variation-diminishing advection; longitudinal dispersivity 10 m and transverse 1 m at the 250 m grid.

The result — plume and vertical structure
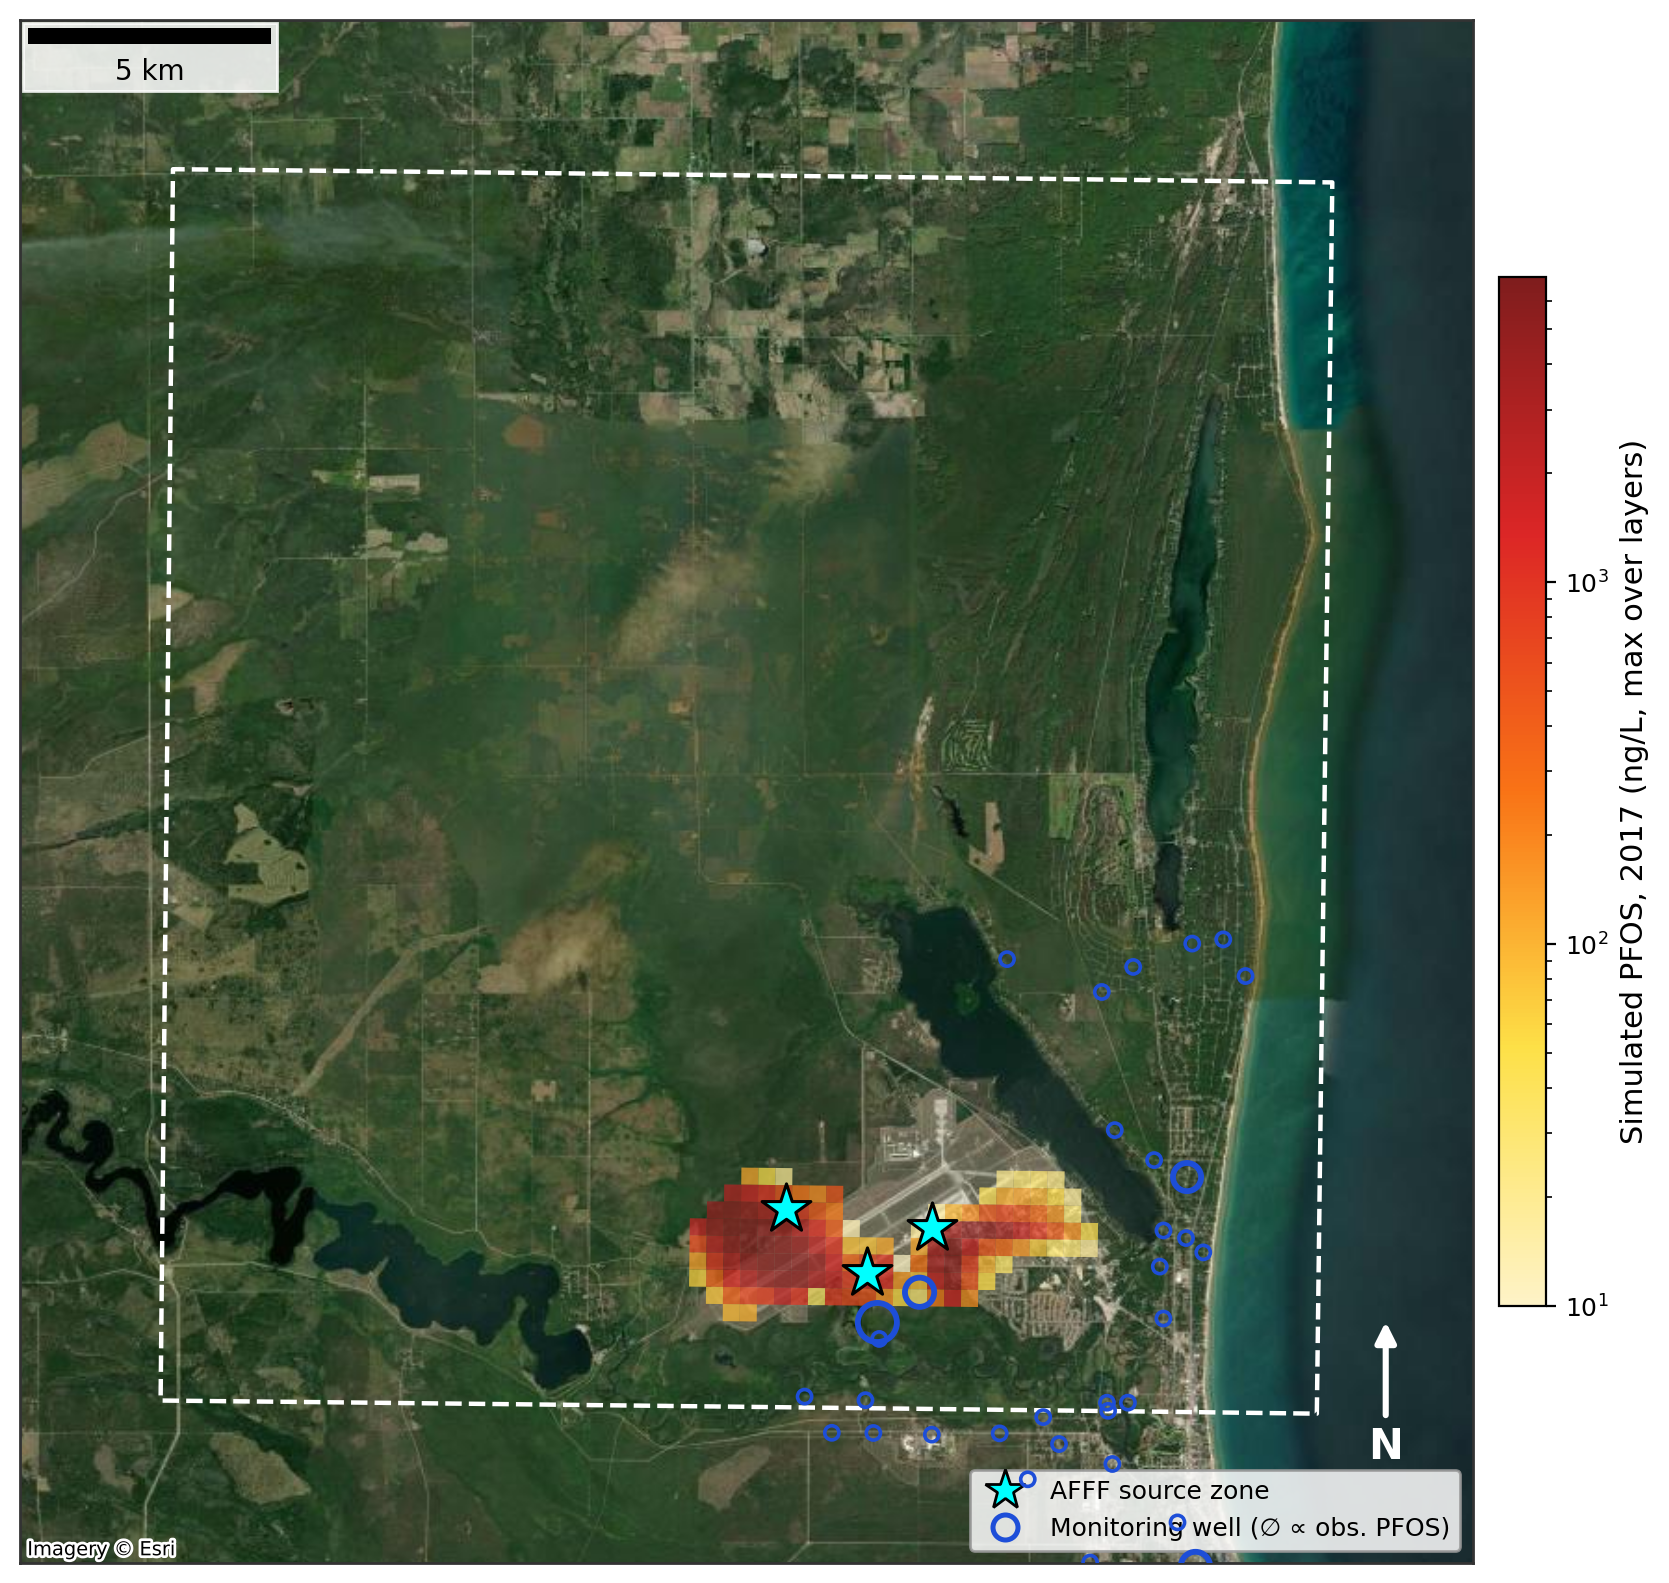
Simulated 2017 PFOS plume at Wurtsmith AFB, with the prescribed AFFF source cell and the monitoring wells
Simulated 2017 PFOS plume: the prescribed AFFF source cell (star), the monitoring-well network sized by observed PFOS, and the model boundary (dashed).
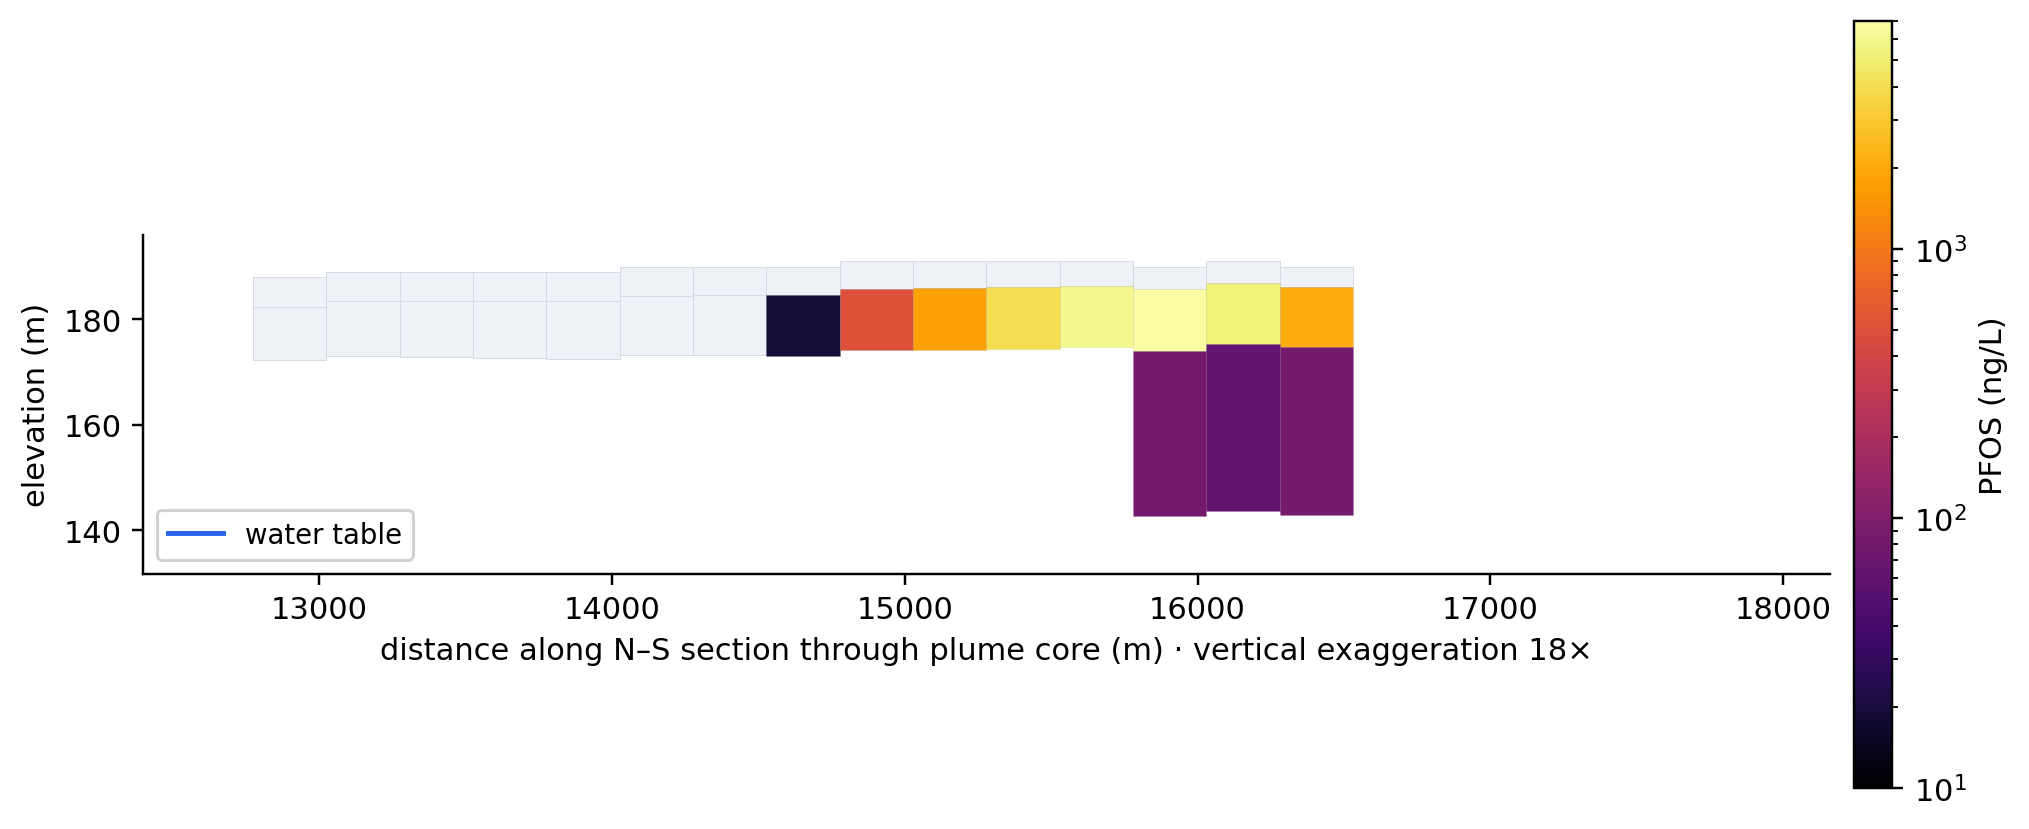
North–south cross-section through the plume core showing the vertical descent
A vertical slice through the plume core: PFOS enters at the water table (blue line) and the core plunges as a deep tail — the shallow-source / deep-plume signature that distinguishes a legacy AFFF site.

What this model does not do. Four limits the manuscript states, kept here beside the plume rather than in a footnote.

PFOS only
This first implementation simulates PFOS. Compound-specific transport with per-analyte isotherms is future work, not something already covered.
PFAS travels one way
In these results the two models are joined offline, with the groundwater model on a steady recharge field; PFAS enters groundwater as a prescribed source and travels one way to the streambed. That one-way coupling is a design choice with a reason — it keeps the in-stream attribution non-circular. In the Rogue River basin the water table lies about 10 m below the surface. At that depth, PFOS spread on the land takes more than a century to reach groundwater (about 150 to 340 years across the recharge rates the study uses), so the PFOS reaching the river today comes from legacy disposal already in the aquifer. PFOA travels faster (about 35 to 75 years over the same rates), so land-applied PFOA can reach the water table within decades.
Transient transport on a steady flow field
Justified by a multi-decadal source history being long relative to seasonal variation, but it omits non-stationary pumping and recharge — a limitation for transient plume timing, not for whether the plume forms.
The source cap is a numerical bound, not a measured ceiling
Sources are capped at 10⁵ ng L⁻¹. The single peak sample reaches 1.5×10⁶ ng L⁻¹, which would make a six-order-of-magnitude front numerically intractable; the validation tests plume shape in log space, not the absolute peak.

By the numbers

150 · 77 km²
two domains
the 30 m site domain holds all 35 monitoring wells; 16 of them fall inside the 250 m watershed model
1971–2024
five decades simulated
AFFF first use to today, from a measured soil source term, no fitted flux
30 m
site resolution
fine-grid flow field, on a domain beside the coarse watershed model

Uncalibrated, and presented as a research demonstration rather than a regulatory product; manuscript in preparation. The source term is measured fire-training-area soil PFAS, not a flux fitted to make the plume match — which is why the agreement above is worth quoting at all. Groundwater observations were extracted from public agency reports.

Model any watershed — or any site within it

Nothing here is bespoke. The watershed-to-site workflow is the one that builds every model on SWATGenX: pick a point, get a coupled SWAT+/MODFLOW 6 package, and refine to a 30 m site model where the plume needs it.