
Nonpoint-source pollution
West-central Florida
Four watershed models with a MODFLOW 6 aquifer beneath each — Tampa Bay, the Peace, the Myakka, and the Hillsborough — feeding two Gulf estuaries with opposite nutrient problems.
One automated pipeline builds them; expert curation finishes them. It is a living page — results are published here, honestly and uncalibrated first, as calibration and water-quality work lands.
The region at a glance
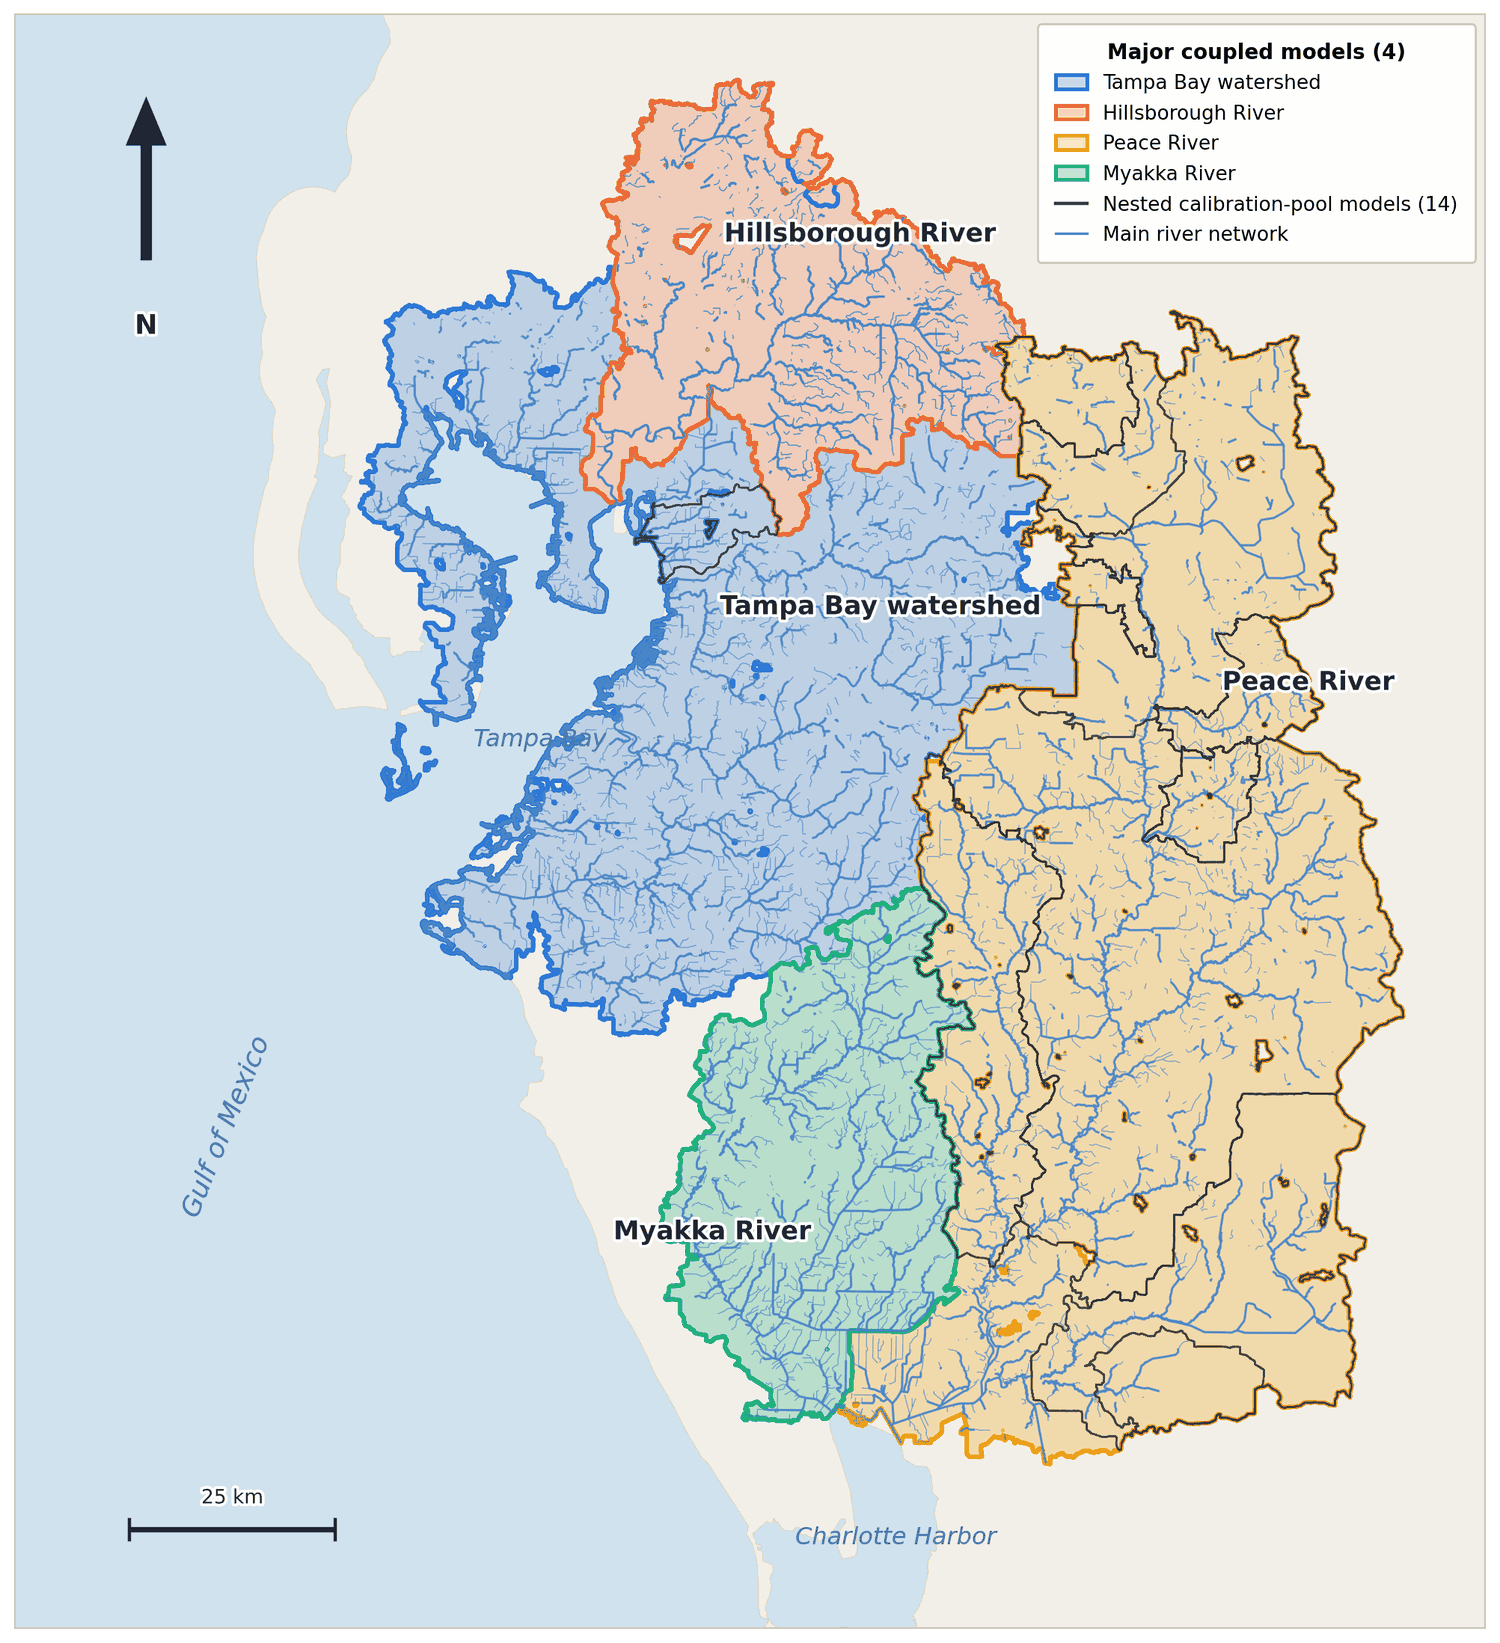
Two Gulf estuaries sit side by side — Tampa Bay to the north, Charlotte Harbor to the south — and four major watershed models drain into them: the integrated Tampa Bay watershed, the Hillsborough, the Peace, and the Myakka.
Nested inside those basins are fourteen smaller, gauge-scale models — one per USGS streamgauge — that seeded the big ones. This is the information cascade in a single picture: small models teach, big models inherit. Each nested watershed was calibrated on its own gauge, and the pooled result becomes a physically-grounded prior for the basin that contains it — which is why the Tampa Bay model can reach Satisfactory skill on a single zero-shot run, before any tuning of its own.
Two estuaries, one method — a controlled contrast
Tampa Bay is nitrogen-limited; Charlotte Harbor is phosphorus-driven. They sit side by side on the same Gulf coast, over the same karst Floridan aquifer system, and the same Bone Valley phosphate district touches both drainages. That makes the pair a natural controlled experiment for nonpoint-source pollution: one source region, one climate, one geology — two opposite nutrient regimes.
This fleet is the instrument for that assessment. Each estuary gets independent tributaries (Tampa Bay: the integrated bay watershed + the Hillsborough; Charlotte Harbor: the Peace + the Myakka), all built with the identical automated method, so cross-basin differences are signal, not modeling artifact. The water-quality assessment itself is the work these models enable — it is planned, not claimed: what you see today is the honest starting point, uncalibrated flow baselines, published before any tuning.
Platform-generated, expert-finished. Every model here started as a standard SWATGenX build — the same automated pipeline anyone can order a watershed from. They were then finished by hand where it counts: per-aquifer target heads harvested from SWFWMD and USGS monitoring records, Florida-specific hydrostratigraphy (surficial aquifer / Hawthorn confining unit / Upper Floridan), and — for the Peace, in progress now — regional multi-gauge calibration. Automation gives the scale; expert curation gives the finish. A watershed–aquifer fleet of this scale and finish is not available anywhere else.
Tampa Bay — integrated watershed model
Tampa Bay is Florida’s largest open-water estuary, and the modern benchmark for nutrient recovery: it is nitrogen-limited, so what the watershed exports — stormwater, wastewater, fertilizer, atmospheric deposition, and events like the 2021 Piney Point release — decides whether its seagrass gains hold.
This is the integrated model of the bay’s tributary drainage: 5,653 km², from the Hillsborough, Alafia, and Little Manatee headwaters (the Bone Valley phosphate district reaches into the Alafia’s upper basin) down to the estuary.
It is the hero model of the fleet — the largest domain, and the densest groundwater control of any Florida build we have made: 940 harvested head-control stations constrain its three-layer MODFLOW 6 companion.
| Streamflow, out of the box (monthly NSE) | Drainage (km²) | Daily NSE | Monthly NSE | Rating |
|---|---|---|---|---|
| Alafia River at Lithia (02301500) | 868 | 0.46 | 0.84 | Very Good |
| Braden River at Lakewood Ranch (02300033) | 66 | 0.42 | 0.82 | Very Good |
| Bullfrog Creek near Wimauma (02300700) | 75 | 0.53 | 0.82 | Very Good |
| Manatee River at SR 64 (02299950) | 169 | 0.35 | 0.78 | Good |
Every USGS gauge is now read at its drainage-area-corrected channel. The automated assignment previously snapped by distance alone, mis-plumbing many gauges onto undersized channels; a drainage-area check re-snaps each gauge to the channel whose modeled area matches the USGS value — no model change, no re-calibration, only which channel each gauge is read from. On the corrected channels, 41 gauges carry enough overlapping record to score on monthly NSE, and 21 rate Satisfactory or better on the calibrated run (15 Good+, 8 Very Good). The viewer draws each gauge’s uncalibrated 10-year baseline and its calibrated hydrograph at that corrected channel; daily scores trail monthly on the flashiest urban canals — the remaining calibration headroom.
Peace River
The Peace River drains the heart of Bone Valley — the phosphate district that has supplied much of U.S. fertilizer phosphorus for over a century — across karstic Upper Floridan terrain to Charlotte Harbor, a phosphorus-driven estuary.
That legacy makes it the natural anchor for a phosphorus story: mining-altered headwaters, reclaimed lands, and a spring-fed, strongly gaining river whose groundwater half matters as much as its surface half.
It is the furthest along in the fleet: its streamflow calibration (our regional multi-memory PSO) is complete — converged at iteration 8 to Good-to-Very-Good skill on the mainstem.
Hillsborough River
The Hillsborough River rises in the Green Swamp and runs about 87 km southwest through Temple Terrace into downtown Tampa, where it meets Hillsborough Bay — and on the way the Hillsborough River Reservoir supplies roughly three-quarters of the City of Tampa’s drinking water, so its nutrient and flow regime is a water-supply question as much as an estuary question.
Its dry-season base flow is spring-fed (Crystal Springs) from the Upper Floridan aquifer, which its MODFLOW 6 companion represents as the third of three layers.
Its heavily urbanized lower basin makes it the fleet’s sharpest stormwater story, and together with the integrated Tampa Bay model it forms the nitrogen-limited half of the two-estuary comparison.
Myakka River
The Myakka — one of Florida’s two designated Wild and Scenic rivers — drains wet-prairie and flatwoods ranchland through Myakka River State Park to Charlotte Harbor.
In the study design it is the control lens: a second, independent tributary to the same phosphorus-driven estuary as the Peace, but without the Peace’s mining footprint — if a phosphorus signal is Bone Valley legacy rather than regional background, these two basins should disagree in a specific, testable way.
The fleet at a glance
| Model | Estuary | Area (km²) | HRUs | Channels | Head stations |
|---|---|---|---|---|---|
| Tampa Bay (integrated) | Tampa Bay | 5,653 | 77,636 | 17,253 | 940 |
| Peace River | Charlotte Harbor | ≈5,980 | 57,998 | 8,181 | 297 |
| Hillsborough River | Tampa Bay | ≈1,690 | 32,380 | 2,750 | 520 |
| Myakka River | Charlotte Harbor | ≈1,560 | 29,069 | 5,655 | 67 |
Areas marked ≈ are the summed modeled HRU areas; the Tampa Bay figure is the model's area. Head stations are the harvested SWFWMD and USGS monitoring wells used to build each aquifer.
First nutrient runs — and why the outlet is not the basin
Three of the four watersheds have now run a full nutrient baseline. The headline result is not a load — it is an accounting one, and it changes how any of these basins should be summed.
A watershed model reports its export at a terminal channel, and that channel is normally treated as the basin outlet. In these coastal basins it is not. Each domain discharges through hundreds of independent exits — a coastal watershed drains around its whole perimeter, not through a single river mouth — and the declared terminus carries only part of the total.
| Watershed | Domain exits | Total exported flow | Terminal channel | Terminus share |
|---|---|---|---|---|
| Peace River | 794 | 3,418 Mm³/yr | 2,056 Mm³/yr | 60% |
| Myakka River | 668 | 837 Mm³/yr | 585 Mm³/yr | 70% |
| Tampa Bay tributaries | 879 | 1,461 Mm³/yr | 317 Mm³/yr | 22% |
Reading an estuary load at the terminal channel alone would therefore understate what the watershed delivers by roughly 1.4× to 4.6×, depending on the basin. It also flipped one of our own conclusions: on terminus-only loads the Peace looked more nitrogen-rich than the Tampa Bay tributaries — backwards for a phosphorus-driven harbor against a nitrogen-limited bay. Summing every exit puts the ordering the right way round. The accounting geometry, not the model parameters, decided that answer.
What the nutrient numbers are, and are not. Hydrology is calibrated; nutrients are not. Scored against Water Quality Portal observations at co-located channels, every constituent currently rates Unsatisfactory on the Moriasi criteria — the model under-predicts phosphorus and ammonium and over-predicts nitrate and sediment. We are publishing that verdict rather than withholding it, for the same reason the uncalibrated streamflow baselines are on this page: it is the honest starting point, and it is what makes the calibration gain measurable. Absolute loads from these runs are a baseline, not an estuary budget. Nutrient calibration is the next step, and a source apportionment will follow it — not precede it.
How these were made — and what they are not
- Automated build. Each watershed came off the standard SWATGenX pipeline (NHDPlus HR delineation, national soils/land-use/climate), then ran a 10-year simulation (2015–2024) with the SWAT+ Check water-balance audit — no manual GIS work.
- Groundwater from harvested data. The MODFLOW 6 companions are standalone, steady-state models built by the same automated pipeline: three Florida layers (surficial / Hawthorn-intermediate / Upper Floridan) from lithology logs, boundary heads kriged from 1,800+ monitoring stations we harvested from SWFWMD and USGS records. Because the same wells built the boundary heads, a head comparison against them is not an independent test.
- Steady-state groundwater in these builds. An automatic build is designed to take its MODFLOW 6 recharge from SWAT+ percolation. These four builds currently use a uniform recharge placeholder instead; replacing it with each basin’s SWAT+ recharge field is the next groundwater step. Daily two-way coupling is separate research work — see how the coupling works.
- Uncalibrated means uncalibrated. Every number on this page is an out-of-the-box baseline. That is deliberate: it shows what the automation alone delivers, and it makes the calibration gains measurable when they land here.