
National groundwater inventory
Groundwater, resolved by depth and lithology
A living, CONUS-wide inventory of water-well records — depth-resolved lithology plus static water levels, yields and screened intervals — harmonized from primary state-agency logs.
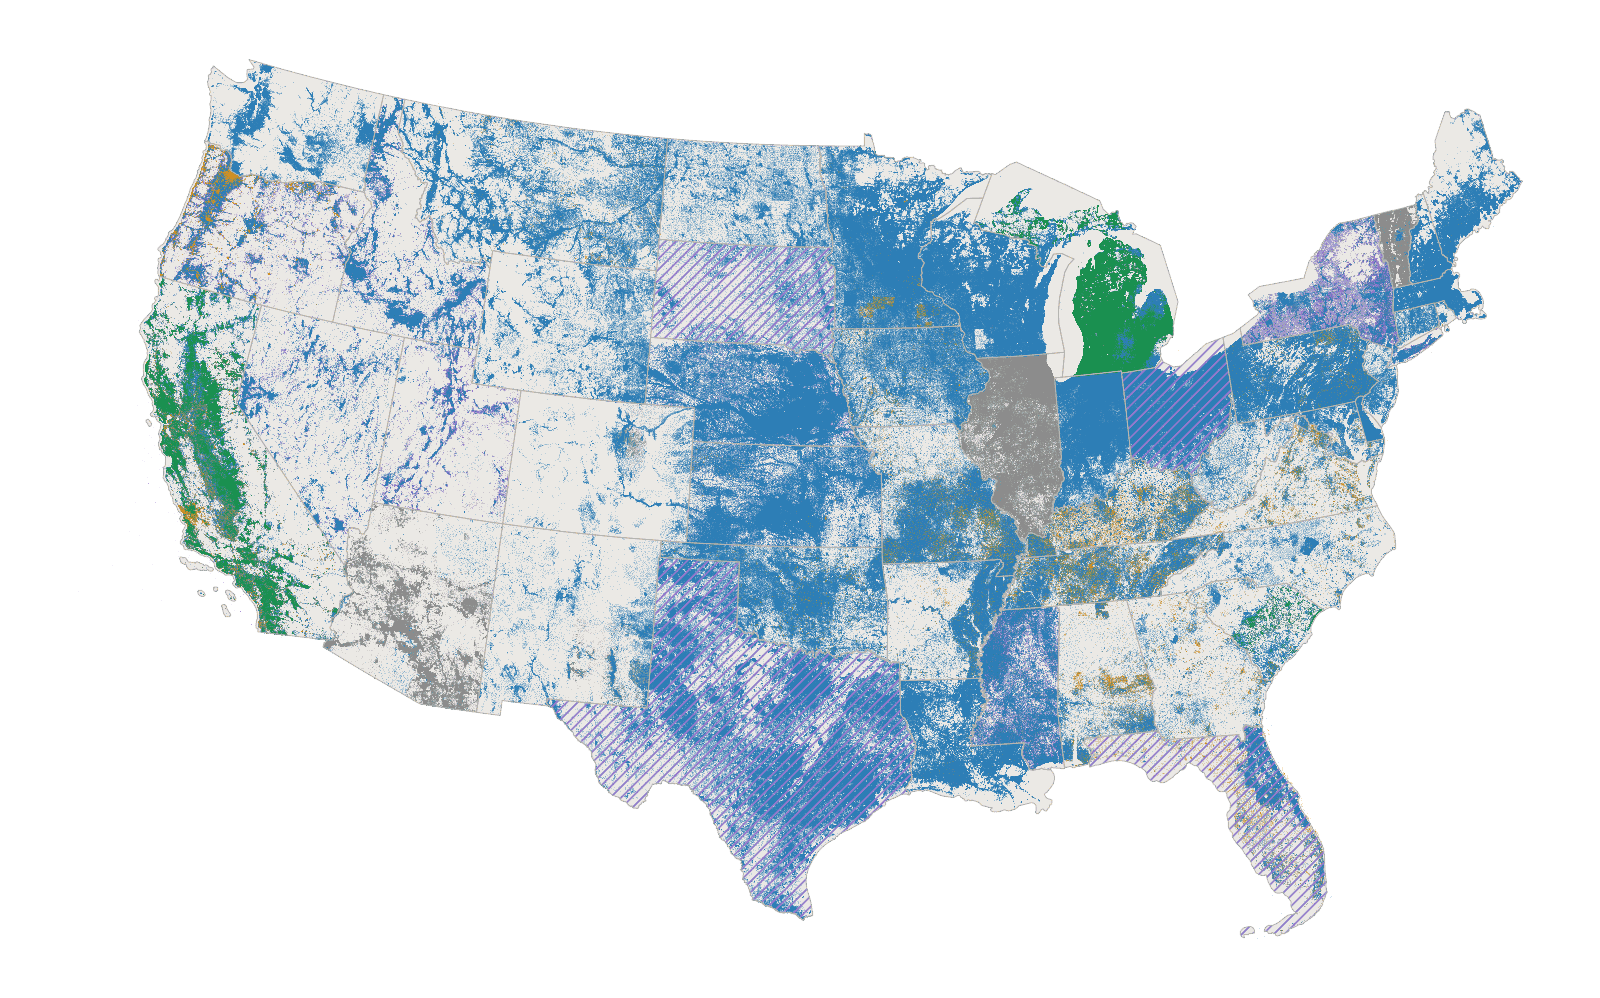
- Well record (no water level or yield)
- + depth, water level or yield
- + screen & yield (model-ready)
- Restricted
- All wells in states with scanned-only logs
- Scanned logs, backlog size not estimated
- Full-resolution map with counts
A living, CONUS-wide inventory of groundwater well records, harmonized from the primary state agency sources — driller and geologist lithology logs, static water levels, total depths, pumping yields, and screened intervals. It exists to answer a practical question: what does the subsurface look like where you want to build a groundwater model?
Every value is as-published by the source agency — no interpolation, no gap-filling, no modeled substitutes. Where an agency only reports a well location, that is all the inventory holds; where it publishes a full lithology log, the inventory holds every depth interval. The counts below read live from the database and grow as new state sources are integrated.
Watch: how the inventory is built
The inventory right now
Live counts from the SWATGenX database (loading…) — updated automatically whenever a new source is integrated.
What each well carries
Wells are tiered by how much of the record the source agency published. The same tiers (and colors) are used by the Groundwater Wells overlay in the Watershed Explorer:
Where the wells are
Every well in the inventory, colored by its data tier. The purple underlay marks wells whose lithology exists today only as a scanned driller's-log document — data that exists but has not yet been digitized. Where the map is truly blank, no public well record was found.
Where the record supports groundwater modeling
Binning the wells into ~5 km cells and weighting each well by its data tier gives a modeling-readiness surface: dark green basins have dense, hydraulics-rich records — enough to krige aquifer properties and parameterize a MODFLOW-class groundwater model. Pale areas are not necessarily data-free: many hold scanned logs awaiting digitization (purple in the map above).
Coverage by state
| State | Well records |
|---|---|
| Loading live coverage… | |
Explore the well inventory on the map
The full inventory is browsable in the Watershed Explorer — the button below opens it with the Groundwater Wells overlay already on, in the MF6-coverage view. Switch to the wells view to see every well colored by its data tier and click any well to read its full lithology log.
How it is built
Each state publishes its well records differently — bulk downloads, ArcGIS services, per-well report pages, or scanned driller's-log documents. The inventory harvests each source with a dedicated, reproducible pipeline and harmonizes the results to one schema: well location, per-interval lithology (top depth, bottom depth, material description), and the hydraulic fields the agency reports (static water level, total depth, yield, screened interval). For states whose logs exist only as scanned documents, a validated vision-model extraction converts handwritten records into structured intervals (~91% material accuracy against human transcription).
The design rule throughout: honest harvest. The inventory reports what the agencies published, at the coverage they published it — a faithful national picture of where subsurface data exists and where it does not.
Publication & collaboration
A research article describing the inventory and its methods has been submitted to Earth System Science Data and is under peer review; the preprint is openly readable. The inventory is browsable here and in the Watershed Explorer.
Source agencies are credited above. State groundwater programs interested in collaborating — including digitizing scanned driller's-log archives — are welcome to get in touch.
Page updated 2026-07-02. Counts on this page are live.