SWATGenXSWATGenX
Watershed ExplorerExample modelsCloud calibrationDocsAccess
Sign inSign up

National PFAS Soil Inventory

Where does PFAS actually sit in the soil — and how much? We harmonized measured soil concentrations from public agency reports across 41 states into one depth-resolved, source-anchored inventory — to our knowledge, the largest harmonized dataset of measured PFAS in U.S. soils. Free to browse, free to download.

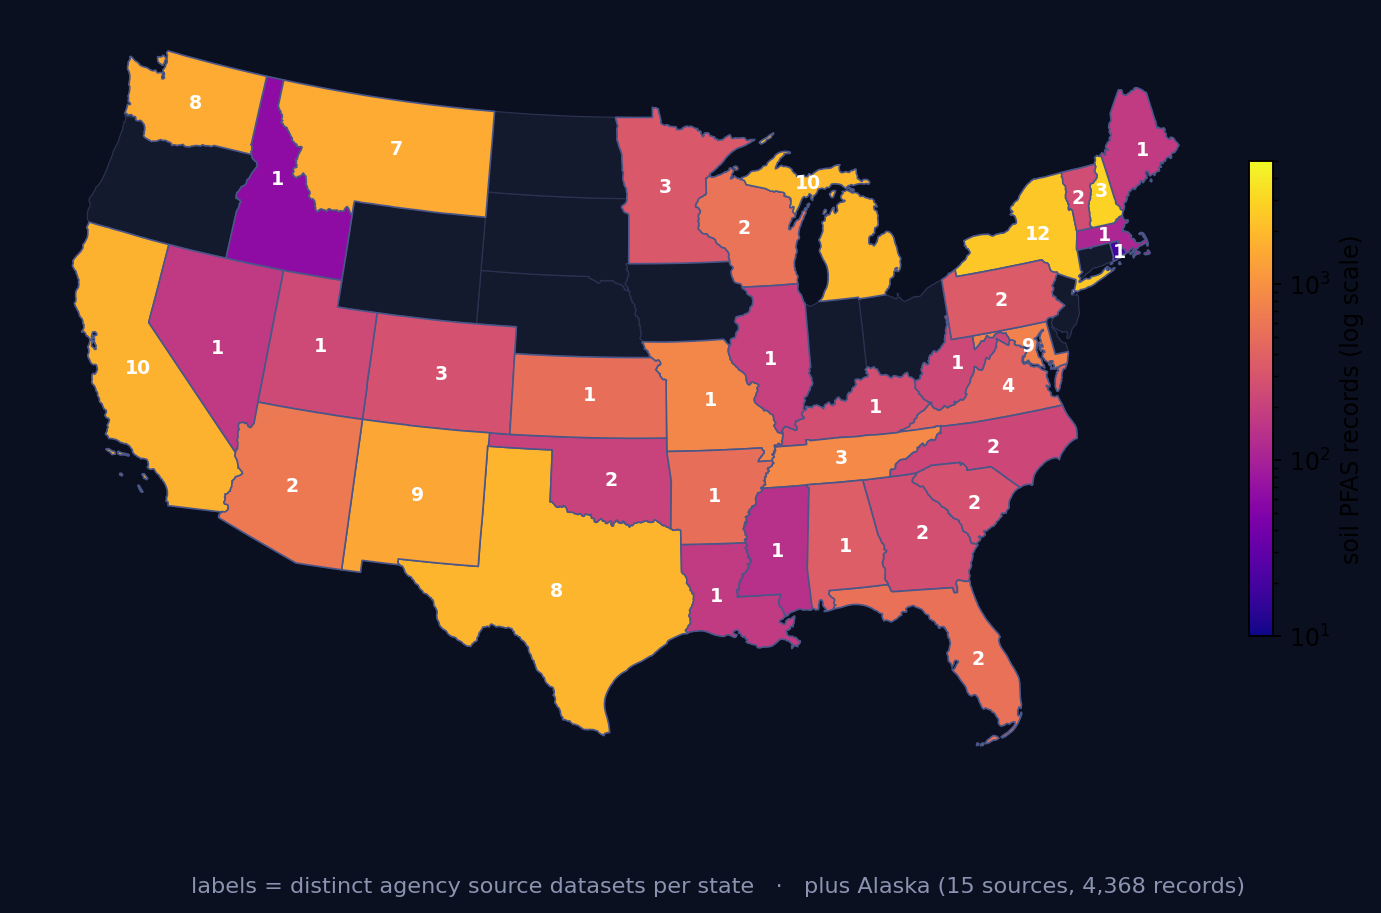
Map of soil PFAS records by state across the United States
Coverage of the inventory: soil PFAS records per state (log color scale), with the number of distinct agency source datasets labeled on each. 37 contiguous states plus Alaska (15 sources, 4,368 records) are represented.

The inventory at a glance

30,972
analytical records
measured soil PFAS concentrations, as reported by the source agency
141
agency source datasets
state environmental agencies, DoD, and remedial investigations
41
states
from Alaska to Florida — wherever public soil PFAS sampling exists
72
PFAS analytes
the full reported panel — PFOS, PFOA, and dozens more compounds
5,812
soil borings
depth-resolved profiles, not just surface grabs
AFFF
dominant source
fire-training areas — the signature soil PFAS setting

Free and open — browse it, download it, cite it

This is, to our knowledge, the largest harmonized, depth-resolved inventory of measured PFAS in United States soils — and it is completely free. It is open research data, not a commercial product: browse every record in the Watershed Explorer without an account, or download the full dataset with a citable DOI. SWATGenX never charges for data — pay-as-you-go pricing applies only to cloud compute for model calibration.

Browse in the Explorer Download the dataset (Zenodo DOI)

Why it exists

No national layer of measured soil PFAS exists — the data is scattered across thousands of pages of state and federal investigation reports, in inconsistent formats, mostly as PDFs. A watershed or groundwater PFAS model that wants a real source term instead of a guess has nowhere to look.

This inventory is that missing layer. Every value is transcribed as-reported from a public document — no interpolation, no modeled substitutes — and kept depth-resolved, so a model can read the actual concentration profile from the surface down toward the water table. The dominant setting is AFFF fire-training areas, the same legacy sources that drive most groundwater PFAS plumes.

The extraction combines deterministic table parsing with a vision-language pipeline for scanned reports, behind ten quality-assurance gates. The method and dataset are described in our national PFAS soil inventory manuscript.

What it feeds

The inventory is the source-term half of coupled PFAS modeling on SWATGenX. Paired with the national groundwater lithology inventory, it lets a SWAT+MODFLOW-6 model start from measured soil concentrations and carry them through the unsaturated zone, the aquifer, and back to the stream — instead of prescribing a plume out of thin air. At sites like Gabreski (Long Island) and Wurtsmith (Michigan), the measured soil profile is the model's input. For the mechanisms that carry PFAS from that soil down through the vadose zone and aquifer, see the PFAS fate & transport guide.