Automated U.S. watershed modeling
Platform Architecture
Automated SWAT+ model creation pipeline: Explorer and API requests, validation and orchestration, async workers, national datasets, and downloadable SWAT+ packages.
- Explorer + API entry points
- Queues & background workers
- National hydro & inputs
- SWAT+ packages & reports
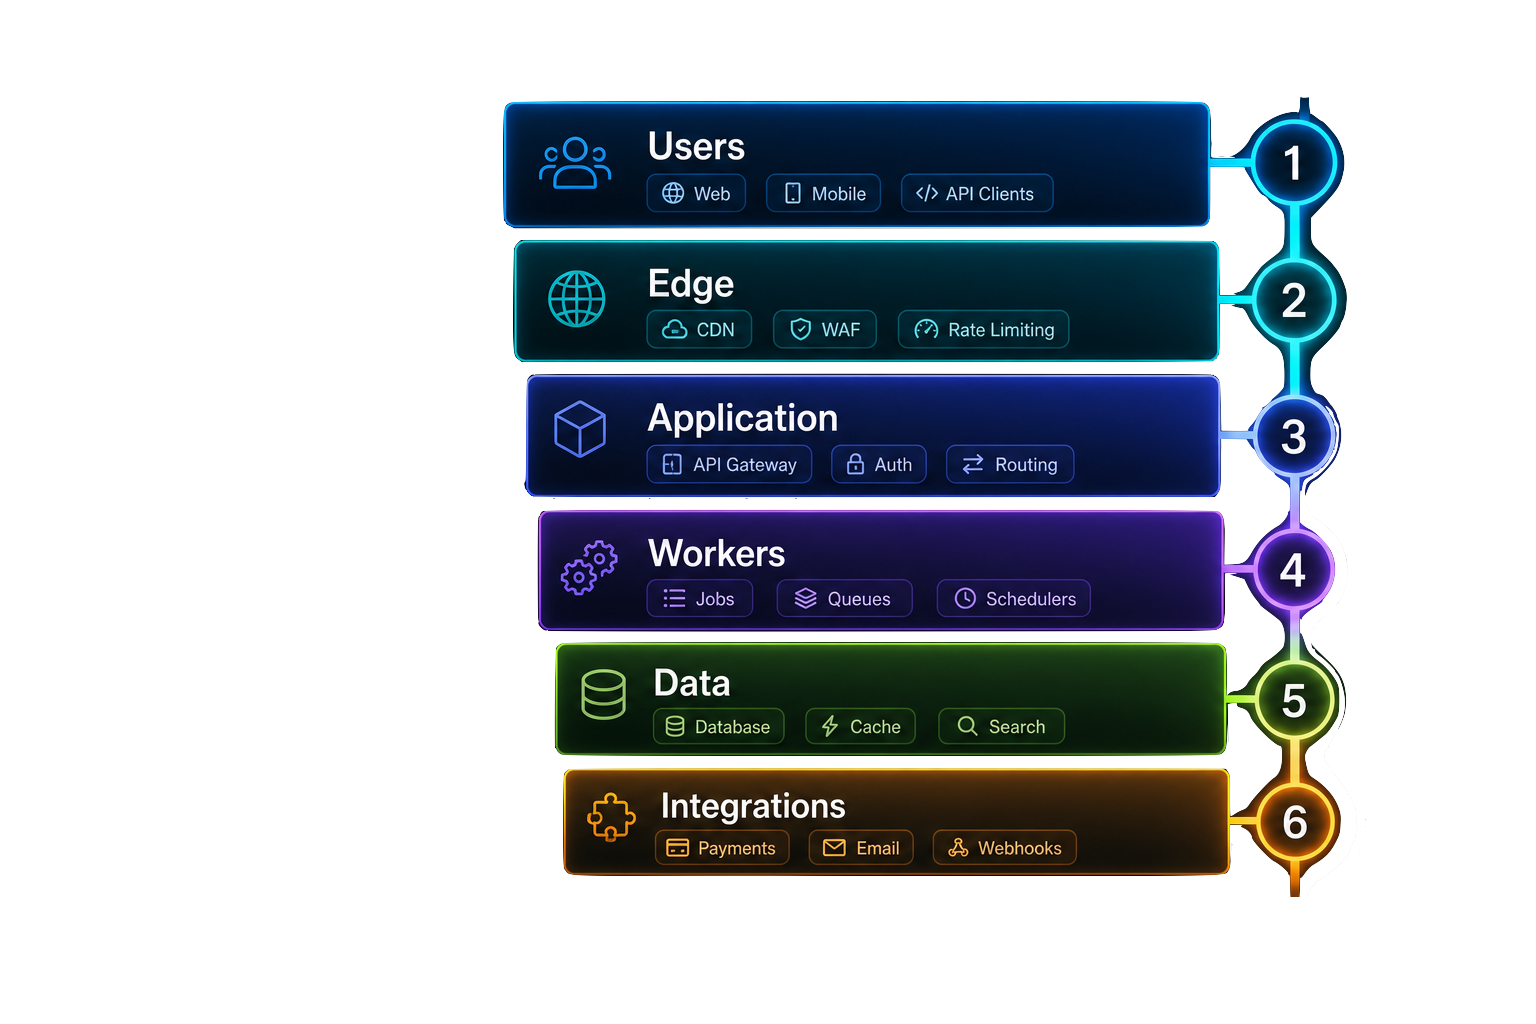
What this means: one request—from the Watershed Explorer or the API—turns national public datasets into a downloadable, ready-to-run SWAT+ model package, with the heavy work handled by background workers instead of your browser.
The same Explorer also surfaces observed water-quality and PFAS monitoring data for screening—about 163,000 EPA/USGS stream nutrient & sediment stations and a multi-source PFAS inventory (federal Water Quality Portal plus state programs)—so you can see measured conditions alongside the modeled ones before you build or calibrate.
Screening is distinct from simulation: beyond these observed-data layers, the platform builds coupled SWAT+/MODFLOW 6 groundwater models (aquifers kriged from state well records), and the open SWATGenX engine simulates PFAS fate and transport — sorption, aquifer transport, and groundwater-to-stream discharge — demonstrated at AFFF sites with a manuscript under peer review. See how the coupling works and the watershed-to-site PFAS demonstration.
SWATGenX is an operational platform: a browser-based watershed interface, authenticated APIs, backend validation and job orchestration, background processing workers, and downloadable artifacts—not only a map or a script collection. For scientific details behind NHDPlus-HR preprocessing, HRU creation, weather inputs, waterbody representation, and SWAT+ package preparation, see Methodology.
System overview
SWATGenX is organized in layers so heavy work never blocks the interactive application:
- User interface — Watershed Explorer, model-order panels, example models, reports, subscriptions, and calibration controls.
- API layer — authenticated endpoints for model creation, order tracking, downloads, and developer workflows.
- Backend orchestration — validation, entitlement checks, job creation, metadata records, queue submission, and status updates.
- Processing workers — long-running geospatial, reporting, SWAT+ assembly, and calibration tasks outside the web UI.
- Data and artifact layer — national input datasets, preprocessed hydrography, generated reports, SWAT+ packages, logs, metadata, and downloadable ZIP files.
User and API layer
Users start model-generation work in two equivalent ways: the Watershed Explorer in the browser, or the Developer API. Both paths submit requests to the same backend model-generation system.
- The interface supports watershed selection, order submission, status tracking, report generation, and download access from the dashboard.
- The API supports repeatable, scriptable workflows—notebooks, batch jobs, and external tools—using the same validation and queue semantics as the UI.
API reference and examples: Developer API.
Backend orchestration layer
Before any background job runs, the backend validates each request: watershed identifiers, signed-in access level, plan quotas, model type, required parameters, and whether the workflow is supported for the selected basin.
- Creates a model order and persists metadata for auditing and status display.
- Submits work to a task queue so the web tier stays responsive.
- Surfaces status updates to both the UI and API consumers (polling or order detail endpoints).
Geospatial and SWAT+ processing layer
Long-running steps run in processing workers, not in the user's browser session. Workers prepare watershed domains, assemble or clip inputs, run geospatial preprocessing, build SWAT+ project structure, generate reports when requested, and package outputs for download.
That separation keeps the SPA responsive while large HUC12, station-centered, or whole-basin jobs continue in the background—potentially for minutes to hours depending on size and queue load.
What happens inside those workers from a science and data perspective is documented under Methodology.
Data and artifact layer
The platform draws on national public datasets and preprocessed hydrography as the foundation for repeatable generation. Outputs can include SWAT+ project folders, inputs, weather files, geospatial sidecars, streamflow context used in screening, PDF reports, run metadata, and consolidated ZIP packages.
Dataset lineage, citations, and preprocessing QA are covered on Methodology—this page stays focused on how the software moves data through the system, not on every source table.
Job lifecycle
Typical path from request to delivered artifact:
- 1. Select or submit a watershed — USGS gage, outlet HUC12 catalog watershed, HUC8 basin, or a 30\u00A0m HUC14 single-catchment site model (drill into a HUC12 and pick catchments) via Explorer or API.
- 2. Validate the request — access tier, quotas, identifiers, workflow type, and required options.
- 3. Queue the job — work is modeled as a background task so the web app does not block on CPU- or IO-heavy steps.
- 4. Build the model package — workers prepare the domain, assemble inputs, run generation steps, and attach reports if ordered.
- 5. Quality checks — required files, routing consistency, metadata completeness, and package readiness before marking success.
- 6. Deliver outputs — completed packages and reports appear in the dashboard, with email notifications where configured; API clients read the same order status and download endpoints.
Access, quotas, and operational controls
Access tiers (Free, Basic, Pro) throttle how much compute and which workflows are available—not only a billing or product-tier label. They protect queue stability, worker capacity, and predictable turnaround when channel density and basin extent grow.
Plan limits and upgrades: Access levels. Completed public packages for timing context: Example models.
Reliability and scalability
SWATGenX is built around asynchronous processing. Large watershed models can take substantial wall time; by decoupling interaction from execution, the platform supports long-running jobs, status tracking, retries where appropriate, and downloads without requiring a single uninterrupted browser session for the full run.
Where to go next
Science & data: Methodology. End-user workflow: How it works. Map-first workspace: Watershed workspace. Published example: Florida Peace River HUC8 case study. SWAT+ model generation: Create SWAT+ models. Comparison: Watershed modeling software. Company: About · Contact.
Broader context: use cases and modeling guide.
Model Creation API examples (Jupyter + Python): GitHub.