SWAT+ delineation QA
SWAT+ drainage area audit (TxtInOut vs NHDPlus HR)
The final QA step before calibration: we read the drainage area SWAT+ actually routes from executable TxtInOut files (chandeg.con) and compare it to the original NHDPlus HR and NWIS values at every gaged channel — every pair shown, outliers investigated instead of averaged away.
QA step 3 of 3 (delineation → gage assignment → this audit). Numbers are computed live from the committed per-gage catalog; the Peace deep-dive below documents every hypothesis we tested.
- 98 gages · 8 models
- 78 of 97 matched pairs within 0.5–2.0
- Median SWAT/NHD ratio 1.10
- Read from executable chandeg.con
This is the third and final step of the SWATGenX streamflow-QA pipeline. The delineation builds the network, gage assignment ties each USGS gage to a channel, and this audit verifies the last link: whether that assigned channel carries the correct drainage area in the executable model. For every gage with an assignment, we read chandeg.con area (hectares → km²) for the matching GIS channel, compare it to the original NHDPlus HR flowline TotDASqKm at the gage, and list NWIS site metadata where available — across all eight publication models, not just the Peace River benchmark.
Read it in order: assignment quality comes first (a wrong-channel pick will look like an area error), so the drainage-area ratios here should be interpreted on the calibration-ready gages identified on the gage-assignment page. That keeps a true SWAT+-vs-NHD area difference from being confused with a mis-assigned gage.
The headline metric is SWAT+ versus NHD on matched reaches: portfolio-wide, 78 of 97 matched station pairs fall within a 0.5–2.0 ratio, with a median SWAT/NHD ratio of 1.10. The population deliberately includes every station — canals and lake outlets too — so the out-of-band pairs are dominated by assignment-review classes rather than conversion errors: on Peace River, 52 of the 54 assignment-clean gages are in-band (median 1.10). Large SWAT+–NWIS gaps are read as tributary-versus-mainstem assignment diagnostics unless SWAT+–NHD also diverges.
Below the portfolio tables, a Peace River deep-dive documents every hypothesis we tested — wrong metric, merged NHD artifacts, orphan reaches, lakes, the polygon stage, and QSWAT/TauDEM-vs-VAA definition differences — in an experiment-log format, so genuine agreement, systematic offsets, and assignment outliers are reported separately rather than averaged together.
Motivation
Portfolio summary (8 evaluation models)
This is QA step 3: with the network delineated and each gage assigned to a channel, we verify the assigned channel carries the right drainage area. The area is reconstructed from executable SWAT+ chandeg.con files (what the model actually routes), compared with original NHDPlus HR TotDASqKm, USGS NWIS site drainage area, and the WBD upstream HU12 sum (model context) at each gaged channel. Because a wrong-channel pick masquerades as an area error, gage assignment comes first; read the ratios here on calibration-ready stations so a true SWAT+-vs-NHD area-definition difference is not confused with a mis-assigned gage. Across 98 stations, 97 have both SWAT+ and NHD values; 78 fall within a 0.5–2.0 SWAT/NHD ratio. Agreement is reported as |SWAT+ − NHD| / NHD × 100 at each gage. Large SWAT–NWIS gaps are treated as gage-assignment diagnostics, not proof of NHD-to-SWAT conversion failure.
- Models
- 8
- Stations
- 98
- Matched SWAT–NHD
- 97
- Within 0.5–2.0×
- 78
Methods
Method notes
- SWAT+ column: TxtInOut/chandeg.con column area (hectares ÷ 100), row matched by GIS channel id (v3 NHD-first/SWAT-second assignment for Peace 03100101; nearest-point assignment elsewhere)
- NHD column: Original NHDPlus HR HU4 geodatabase flowline TotDASqKm within 500 m of gage (domain-clipped)
- NWIS column: meta_{VPUID}.csv nwis_drain_area_km2 (USGS NWIS site-service drain_area_va / contrib)
- |Δ| vs NHD = |SWAT+ − NHD| / NHD × 100 (same information as SWAT/NHD ratio, expressed as percent difference from NHD).
- the assigned GIS channel matches
gis_idinchandeg.con; SWAT lcha is the routing index forchannel_sdoutput (they differ when noted).
Understanding SWAT+ vs NHDPlus HR
Portfolio tables above compare executable chandeg.con drainage area (what SWAT+ runs) with original NHDPlus HR TotDASqKm at each gaged channel — not the post-processed national network. For the large Peace River HUC-8 model we traced where differences enter the pipeline (phases 1–3), using data-backed scrutiny similar to the calibration runtime benchmark experiment log.
Frozen audit chain (Peace mainstem): Original NHD and cleaned-flowline reach TotDASqKm match; post-processed polygon upstream area is ~+2–3% vs NHD; QSWAT AreaC and chandeg.con are ~+15–17% on mainstem. The offset first appears at the QSWAT/SWAT+ channel-area stage.
TotDASqKm 856.95 km²; local reach AreaSqKm ~3.6 km² (misleading if compared to SWAT+); SWAT+ chandeg 1,002.2 km² (~17% vs TotDASqKm).Pipeline stages (Peace 10-gage panel)
| Stage | Source | Mainstem median vs NHD | Role |
|---|---|---|---|
| A | Original NHD TotDASqKm (zip VAA) | ×1.00 | Reference |
| G | cleaned-flowline reach TotDASqKm | ×1.00 | Pre-QSWAT attribute |
| B | Original upstream Σ AreaSqKm (zip) | ×1.00 | Cross-check |
| C | Cleaned flowline-network upstream Σ | ×0.99 | Secondary |
| D | processed watershed-polygon upstream Σ | ×1.03 | SWATGenX post-processed polygons (national clip; not per-project QSWAT shapes) |
| E | QSWAT AreaC at assignment | ×1.17 | First large exceed |
| F | chandeg.con (executable SWAT+) | ×1.17 | Headline audit column |
| H | rivs1.AreaC / SQLite (live) | — | Pending artifact restore |
Stage D uses the processed national watershed polygons clipped to Peace HUC-12s — not necessarily identical to per-project QSWAT Watershed/Shapes when those files are missing.
Open item: reading the channel area directly from the live QSWAT+ project (rivs1.AreaC) is still pending for this model; it would confirm whether the offset is already present in the QSWAT+ project channel area or is introduced only in the SWAT+ text export.
Hypotheses investigated
Hypotheses investigated (Peace deep-dive)
Each item below was tested with reproducible scripts and CSV traces archived with the publication materials. Status reflects the weight of evidence on Peace mainstem gages unless noted as a separate outlier class.
Phase 1 — Comparing cumulative SWAT+ to local NHD reach area
Is the gap because chandeg.con is cumulative but we compared to local AreaSqKm?
No — headline metrics use NHD TotDASqKm (cumulative VAA).
- Peace @ SR 60 (02294650): NHD TotDASqKm 857 km² vs local reach AreaSqKm ~3.6 km²; SWAT+ chandeg 1002 km² aligns with cumulative scale.
- Median |Δ| vs TotDASqKm on 73 matched Peace gages: ~10.2%; vs local reach area: misleading (~14,900% median).
Phase 2 — Accidentally comparing to post-processed cleaned NHD flowlines / processed watershed polygons
Does the offset come from comparing SWAT+ to already-merged national artifacts?
No — headline NHD is from the original HU4 geodatabase zip, not the merged post-processed network.
- nhd_totdasqkm_km2 and upstream Σ AreaSqKm are computed from unzipped NHDPlusFlowlineVAA on the domain-clipped zip.
- Cleaned flowline-network upstream Σ is only ~1–2% below zip on mainstem — far smaller than the ~15–17% SWAT+ excess.
Phase 2 — NHD TotDASqKm inconsistent with upstream Σ AreaSqKm
Is NHD VAA internally inconsistent on mainstem reaches?
No on Peace mainstem — TotDASqKm and upstream Σ AreaSqKm agree (e.g. 857 km² at 02294650).
- Phase 2 crosswalk: original zip TotDASqKm matches original upstream catchment sum on mainstem picks.
- The ~145 km² SWAT−NHD gap (1002 − 857) is not explained by VAA definition mismatch alone.
Phase 1 — Orphan catchment merge onto mainstem
Did orphan-catchment dissolution pile extra area onto mainstem NHD IDs?
Unlikely for the systematic mainstem +10–17% band.
- Domain preprocess merges hundreds of orphans nationally; per-gage geometry tests did not stack orphan area on Peace mainstem NHD IDs.
- Post-processed polygon upstream Σ (stage D) is only ~+2–3% vs NHD — not +15–17%.
Phase 1 — SWAT+ omits lakes that NHD counts
Does lake/waterbody handling explain SWAT+ > NHD on mainstem?
Not the dominant pattern — SWAT+ is higher than NHD, not lower.
- Lake omission would bias SWAT+ low vs NHD; mainstem shows systematic positive bias (60/73 matched gages SWAT+ > NHD).
- Upstream WB-linked waterbody area at 02294650 (~126 km²) is too small to explain ~145 km² SWAT−NHD alone.
Phase 3 — SWATGenX pre-inflated TotDASqKm before QSWAT
Did the cleaned NHD flowlines or preprocessing corrupt the reach drainage attribute before QSWAT?
No — reach TotDASqKm in the cleaned NHD flowlines matches original zip NHD within <0.1% on the panel.
- 02294650: zip 856.95 km² vs the cleaned NHD flowlines 856.95 km²; QSWAT AreaC (README) 1002.2 km².
- 02294760: zip 891.56 vs the cleaned NHD flowlines 891.56; AreaC 1046.57 km².
Phase 3 — SWATGenX post-processed watershed polygons
Does the processed national watershed polygons upstream area carry the mainstem offset?
Not as the primary source — stage D is ~+2–3% vs NHD on mainstem panel.
- 02294650: polygon upstream Σ 874 km² vs NHD 857 km² (+2%); chandeg 1002 km² (+17%).
- Median polygon/NHD ≈ 1.03 on three mainstem panel gages; median chandeg/NHD ≈ 1.17.
Phase 3 — QSWAT copied a wrong drainage column from the SWAT+ stream layer
Did QSWAT copy an inflated area field we exported on the channel shapefile?
Unlikely — the SWAT+ stream layer has no TotDASqKm or AreaC column.
- SWATGenX write_output exports topology, length, elevations, and lake flags only — not drainage-area attributes.
- Offset appears at QSWAT AreaC / chandeg, not at reach attributes in the cleaned NHD flowlines.
Phase 3 — QSWAT/TauDEM contributing area vs NHD VAA
Why does SWAT+ cumulative drainage exceed original NHD on mainstem?
Leading explanation: delineation-definition difference, not necessarily a preprocessing bug.
- Polygons and NHD reach attributes agree; QSWAT AreaC and chandeg.con jump ~+15–17% at the same stage.
- Protects NHDPlus HR preprocessing; narrows issue to QSWAT/TauDEM channel-area semantics or SWAT+ export.
Phase 3 — Live rivs1.AreaC / SQLite before chandeg export
Is the offset already in rivs1 before TxtInOut, or introduced at text export?
Pending — Peace Watershed/Shapes not on disk; re-run phase 3b after restore.
- If rivs1 AreaC ≈ chandeg ≫ NHD: QSWAT/TauDEM channel area creates the offset.
- If rivs1 ≈ NHD but chandeg high: SWAT+ text export introduces the offset.
Phase 1 — Gage–channel assignment outliers
What about extreme SWAT/NHD ratios on tributary or mis-assigned gages?
Separate class — not basin-wide conversion failure.
- Peace: 7 assignment outliers flagged; e.g. tiny SWAT+ vs large NHD on tributary picks.
- Three gages lack chandeg rows (reservoir/auxiliary channels) — reported explicitly, not folded into headline metrics.
Results and discussion
Peace pipeline trace (10-gage panel)
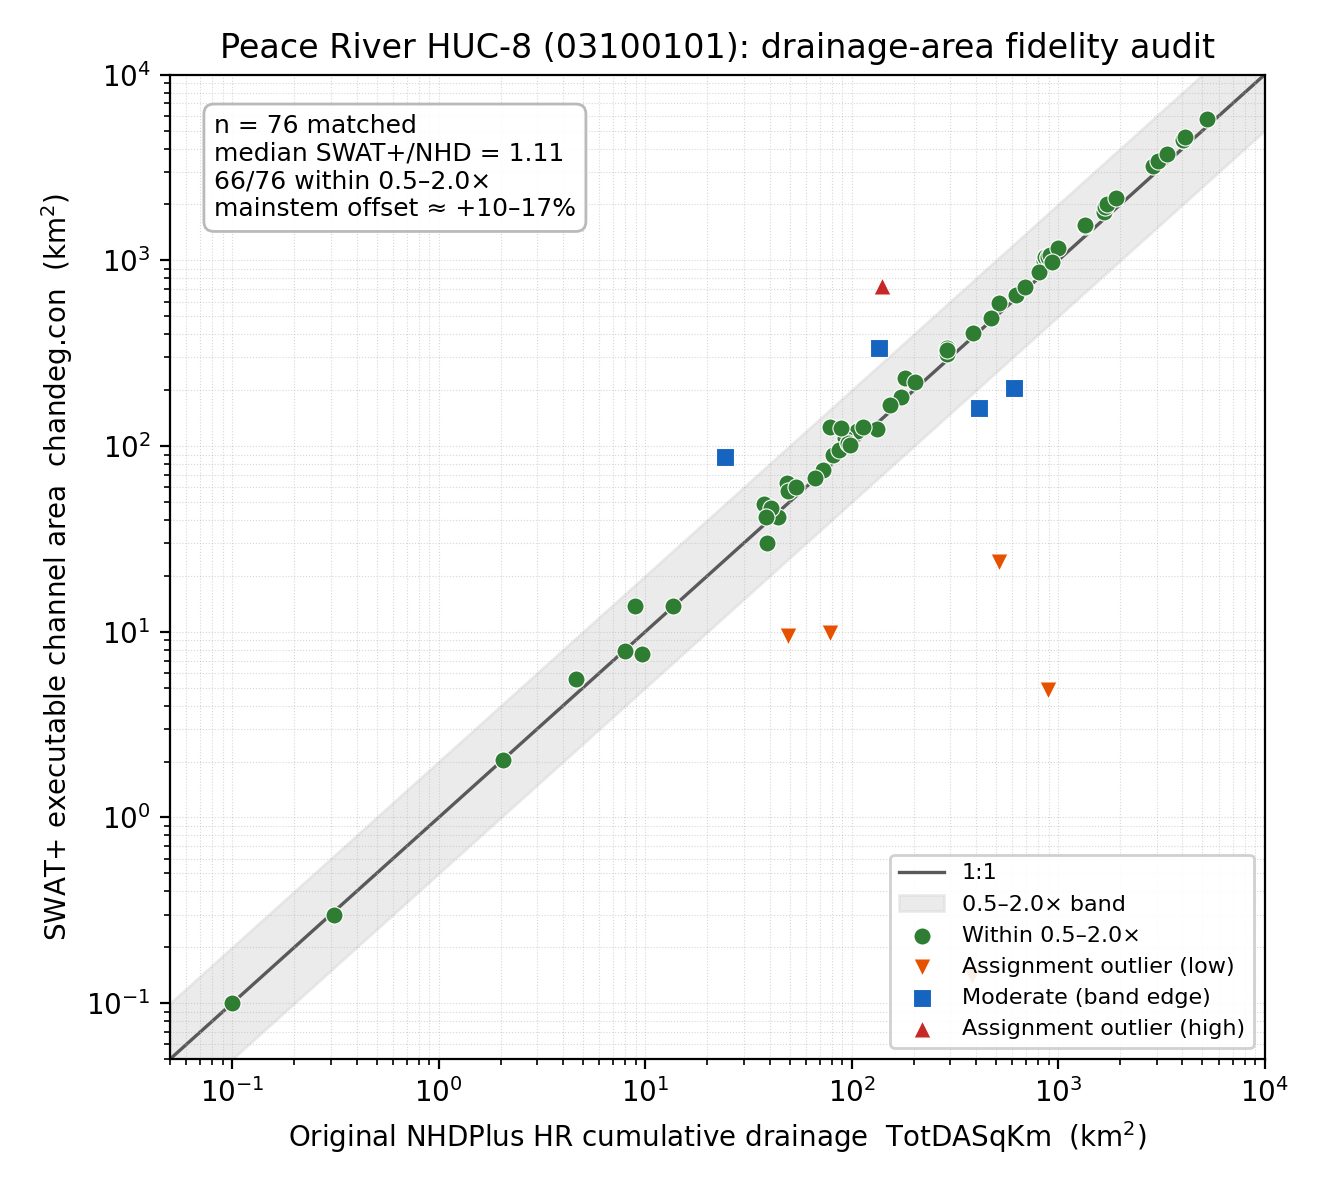
Peace River HUC-8: 76 matched SWAT–NHD; median SWAT/NHD ratio 1.1178; 65 within 0.5–2.0×. Values in km² unless noted.
| USGS | Panel role | NHD (A) | Cleaned flowlines (G) | Polygons (D) | QSWAT AreaC (E) | chandeg (F) | |Δ| vs NHD |
|---|---|---|---|---|---|---|---|
| 02294650 | mainstem 15 17 | 856.95 | 856.95 | 874.22 | 1,002.2 | 1,002.2 | 16.9% |
| 02294760 | mainstem 15 17 | 891.56 | 891.56 | 914.81 | 1,046.57 | 1,046.57 | 17.4% |
| 02294898 | mainstem 15 17 | 995.39 | 995.39 | 1,021.98 | 15.13 | 1,162.67 | 16.8% |
| 02295420 | moderate 20 40 | 181.28 | 181.28 | 186.22 | 231.22 | 231.22 | 27.5% |
| 02296389 | moderate 20 40 | — | — | — | 176.08 | 176.08 | — |
| 02294747 | outlier low | 13.19 | 13.19 | 19.16 | 12.08 | 22.98 | 74.2% |
| 02295440 | outlier low | 1.76 | 1.76 | 1.76 | 25.13 | 1.76 | 0.2% |
| 02293694 | lake canal | 78.53 | 78.53 | 9.82 | 209.01 | 9.8 | 87.5% |
| 02294330 | lake named | 44.99 | 44.99 | 44.99 | 59.84 | 59.84 | 33% |
| 02297600 | control good | 153.72 | 153.72 | 157.23 | 165.61 | 165.61 | 7.7% |
SWAT+ vs NHDPlus HR drainage area
Each point is one gaged channel: x = original NHDPlus HR TotDASqKm, y = SWAT+ chandeg.con area (km²). The dashed line is 1:1 agreement. Log axes are used when drainage areas span more than one order of magnitude.
Peace station assignment (v3, production streamflow)
Peace River rows in the portfolio tables above use v3 NHD-first / SWAT-second GIS channel ids when looking up chandeg.con area (same method used for current streamflow extraction), not the legacy da_distance channel in older assignment snapshots. Per-gage assignment class, mapping method, and calibration funnel are on the USGS station → SWAT+ assignment page.
Missing rows & assignment outliers
These stations are flagged for follow-up (reservoir/auxiliary objects, tributary vs mainstem assignment). They are excluded from the headline SWAT/NHD success metric unless both areas exist.
| USGS site | Station name | GIS ch. | SWAT lcha | SWAT+ DA (km²) | NHD HR (km²) | USGS site (km²) | WBD HU12↑ (km²) | SWAT/NHD | |Δ| vs NHD |
|---|---|---|---|---|---|---|---|---|---|
| 02297345 | PEACE RIVER AT PLATT FL | 183 | 179 | 4,463.27 | 2.44 | — | 4,599.15 | 1,832.06 | 182,820.9% |
| 02294747 | SIXMILE CREEK AT BARTOW FL | 427 | 405 | 1,046.57 | 13.19 | — | 1,448.27 | 79.34 | 7,834.6% |
| 02296389 | OAK CREEK NEAR GARDNER FL | 598 | 565 | 732.11 | 140.64 | 168.61 | 173.93 | 5.21 | 420.6% |
| 02293986 | PEACE CREEK DRAINAGE CANAL NEAR ALTURAS FL | 6,643 | 5,774 | 0.14 | 381.12 | 414.4 | 593.05 | 0 | 100% |
| 03151500 | L KANAWHA R NR BURNSVILLE, WV | 946 | 907 | 2.84 | 400.39 | 401.45 | 559.42 | 0.01 | 99.3% |
| 09499500 | TONTO C NR ROOSEVELT ARIZ | 1,220 | 1,220 | 30.77 | 2,070.97 | 2,178.18 | 2,193.73 | 0.01 | 98.5% |
| 02239600 | TRIBUTARY TO SILVER RIVER AT SH 40 NEAR OCALA FL | 2 | 2 | 0.62 | 34.92 | — | 53.37 | 0.02 | 98.2% |
| 02239601 | TRIBUTARY TO SILVER RIVER BL SH 40 NR OCALA, FL | 2 | 2 | 0.62 | 34.92 | — | 53.37 | 0.02 | 98.2% |
| 02297310 | HORSE CREEK AT SR 72 NEAR ARCADIA, FL | 1,307 | 1,235 | 23.72 | 516.24 | 564.62 | 627.96 | 0.05 | 95.4% |
| 05536270 | NORTH CREEK NEAR LANSING, IL | 16 | 16 | 2.71 | 42.72 | 43.51 | 56.97 | 0.06 | 93.7% |
| 02239501 | SILVER RIVER NEAR OCALA, FL | 2 | 2 | 0.62 | 5.99 | — | 53.37 | 0.1 | 89.6% |
| 02293694 | PEACE CREEK DRAINAGE CANAL NEAR DUNDEE FL | 1,008 | 960 | 9.8 | 78.53 | 150.22 | 392.56 | 0.12 | 87.5% |
| 09498800 | TONTO CREEK NEAR GISELA, ARIZ. | 1,003 | 1,003 | 145.45 | 1,118.93 | 1,113.69 | 145.48 | 0.13 | 87% |
| 03151915 | SAND FORK NEAR GLENVILLE, WV | 87 | 75 | 35.09 | 204.95 | 204.87 | 207.62 | 0.17 | 82.9% |
| 02295521 | LT CHARLIE CR BL PARKER BRANCH NR BOWLING GREEN FL | 3,144 | 2,777 | 9.47 | 49.28 | — | 121.85 | 0.19 | 80.8% |
| 07174000 | Little Caney River near Copan, OK | 1 | — | — | 1,103.86 | 1,098.15 | 1,116.88 | — | — |
By evaluation model
Oklawaha (FL) (03080102)
- Stations
- 3
- SWAT+ chandeg area
- 3
- NHD TotDASqKm
- 3
- USGS site (NWIS)
- 0
- Matched SWAT–NHD
- 3
- Median |Δ| vs NHD
- 98.2%
- Median SWAT/NHD ratio
- 0.0176
- Within 0.5–2.0× (SWAT/NHD)
- 0 / 3
- Missing chandeg
- 0
- Assignment outliers
- 3
SWAT+ vs NHDPlus HR drainage area
Each point is one gaged channel: x = original NHDPlus HR TotDASqKm, y = SWAT+ chandeg.con area (km²). The dashed line is 1:1 agreement. Log axes are used when drainage areas span more than one order of magnitude.
| USGS site | Station name | GIS ch. | SWAT lcha | SWAT+ DA (km²) | NHD HR (km²) | USGS site (km²) | WBD HU12↑ (km²) | SWAT/NHD | |Δ| vs NHD |
|---|---|---|---|---|---|---|---|---|---|
| 02239600 | TRIBUTARY TO SILVER RIVER AT SH 40 NEAR OCALA FL | 2 | 2 | 0.62 | 34.92 | — | 53.37 | 0.02 | 98.2% |
| 02239601 | TRIBUTARY TO SILVER RIVER BL SH 40 NR OCALA, FL | 2 | 2 | 0.62 | 34.92 | — | 53.37 | 0.02 | 98.2% |
| 02239501 | SILVER RIVER NEAR OCALA, FL | 2 | 2 | 0.62 | 5.99 | — | 53.37 | 0.1 | 89.6% |
Conclusion
What we conclude
Across 8 evaluation models, drainage-area agreement is generally good (78 of 97 matched station pairs within 0.5–2.0× SWAT/NHD). Peace River mainstem gages show a systematic ~10–17% excess in SWAT+ cumulative area vs original NHD VAA that is not explained by comparing to local reach area, using merged NHD artifacts, NHD VAA inconsistency, orphan merge, lake omission, pre-inflated TotDASqKm on the cleaned NHD flowlines, or post-processed polygon accounting alone.
The leading interpretation is a delineation-definition difference between NHDPlus HR hydrosequence cumulative drainage and QSWAT/TauDEM-derived channel contributing area — not necessarily a SWATGenX preprocessing error. That protects the NHDPlus HR method used in model generation while flagging channel-area semantics for calibration interpretation. Assignment outliers and missing chandeg rows remain a separate review class.
Open item: live rivs1.shp / project SQLite on Peace to confirm whether the offset is fully established before chandeg.con export.
FAQ
How accurate are SWAT+ drainage areas compared to NHDPlus HR?
Close, at the executable-model level: across eight evaluation models, 78 of 97 gage–channel pairs with both values fall within a factor-of-two band (0.5–2.0 SWAT/NHD ratio), with a portfolio median ratio of 1.10. The out-of-band pairs concentrate in assignment-review stations (canals, lake outlets) rather than area-conversion errors — on the Peace River model, 52 of the 54 assignment-clean gages are in-band (median 1.10). Peace mainstem reaches carry a documented systematic +10–17% SWAT-over-NHD offset that traces to a QSWAT/TauDEM-vs-NHD-VAA delineation-definition difference, not a preprocessing bug.
Why compare chandeg.con instead of shapefiles?
Shapefiles and SQLite exports document preprocessing products, but SWAT+ executes from TxtInOut. The chandeg.con area column is what the solver uses for channel contributing drainage area at each reach.
Why can SWAT+ and NWIS drainage areas disagree when SWAT+ and NHD agree?
NWIS drainage area describes the gage watershed metadata, while the assigned GIS channel may be a tributary reach. SWAT+ versus NHD is the direct check that NHDPlus HR drainage accounting survived into executable model files.
What does “missing chandeg row” mean?
The station is linked to a GIS channel id that does not appear in chandeg.con—often reservoir outlets or auxiliary routing objects. Those rows are flagged for assignment review, not hidden as conversion errors.
Why can Peace River mainstem gages show ~10–17% higher SWAT+ than NHD TotDASqKm?
A phased trace on a 10-gage Peace panel shows the offset first appears at QSWAT channel AreaC and chandeg.con, not at original NHD VAA, cleaned-flowline reach TotDASqKm, or post-processed watershed polygons (~+2–3% there). The leading interpretation is a delineation-definition difference between NHDPlus HR cumulative drainage and QSWAT/TauDEM contributing area—not necessarily a preprocessing bug.
Did SWATGenX inflate NHD drainage area before QSWAT?
No on the tested reaches: original zip TotDASqKm and cleaned-flowline reach TotDASqKm match within 0.1% (e.g. 02294650: 856.95 km² both). the SWAT+ stream layer does not export a drainage-area column for QSWAT to copy. Live rivs1 verification is pending where project shapes are not on disk.
Related guides
Explore related
Last updated 2026-07-13.