Automated U.S. watershed modeling
How it works
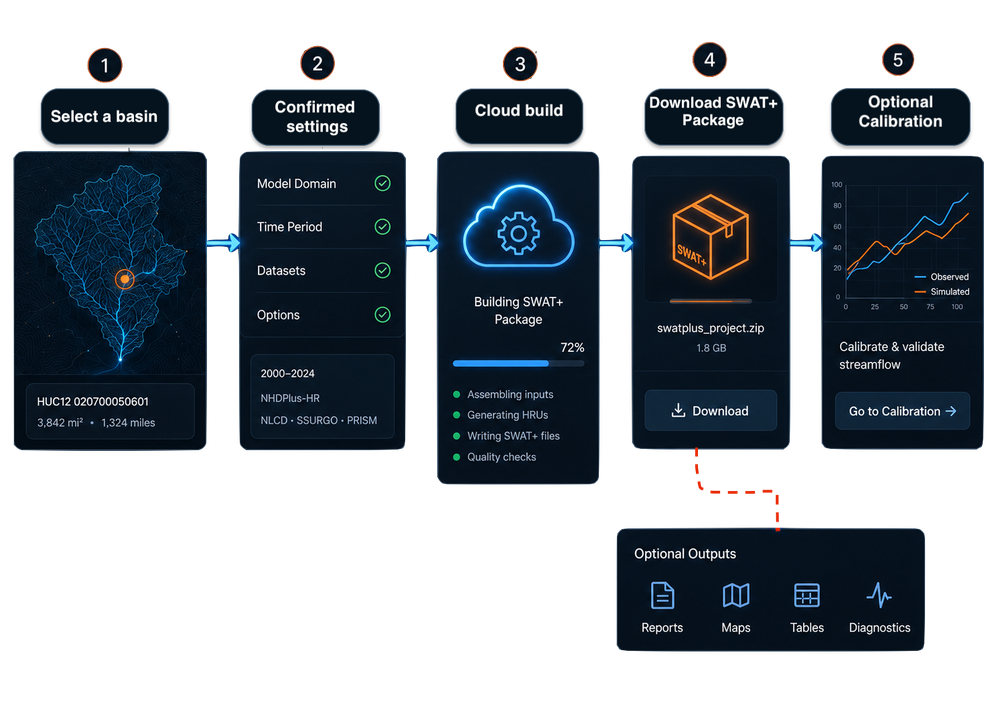
Pick a basin, confirm settings, track the build, then download a SWAT+ package—or continue into optional calibration. Screening maps and reports stay in the browser; heavy assembly runs in the cloud.
- Built on NHDPlus-HR and public datasets
- Automated cloud build and QA
- Proven calibration methods and checks
- Open, reproducible SWAT+ packages
What this page covers
This walkthrough follows the Create SWAT+ model modal in the workspace: watershed choice, confirmation, progress, and calibration-related options. For dataset lineage, routing prep, and QA, use the methodology hub. For PSO hydrology calibration, validation scoring, and bounds, use Calibration methods—those pages stay authoritative so we do not duplicate long technical prose here.
WBD and NHDPlus HR nesting (CONUS prep)
SWATGenX builds on the USGS Watershed Boundary Dataset (WBD) and NHDPlus High Resolution (NHDPlus HR). The table below names each nested level, what it means, and the approximate national footprint in our CONUS hydro prep.
| Unit | What it is | CONUS extent (this prep) |
|---|---|---|
| Region (HUC2) | USGS water-resource region—the broadest WBD tier (two-digit code). | 21 |
| VPUID (HUC4 subregion) | NHDPlus vector processing unit: the four-digit hydrologic subregion NHDPlus HR ships and processes as a unit (same prefix as HUC8/HUC12). | 233 |
| HUC8 (subbasin) | Eight-digit WBD subbasin; whole-basin SWAT+ jobs can use an entire HUC8 as the model domain. | 2,246 |
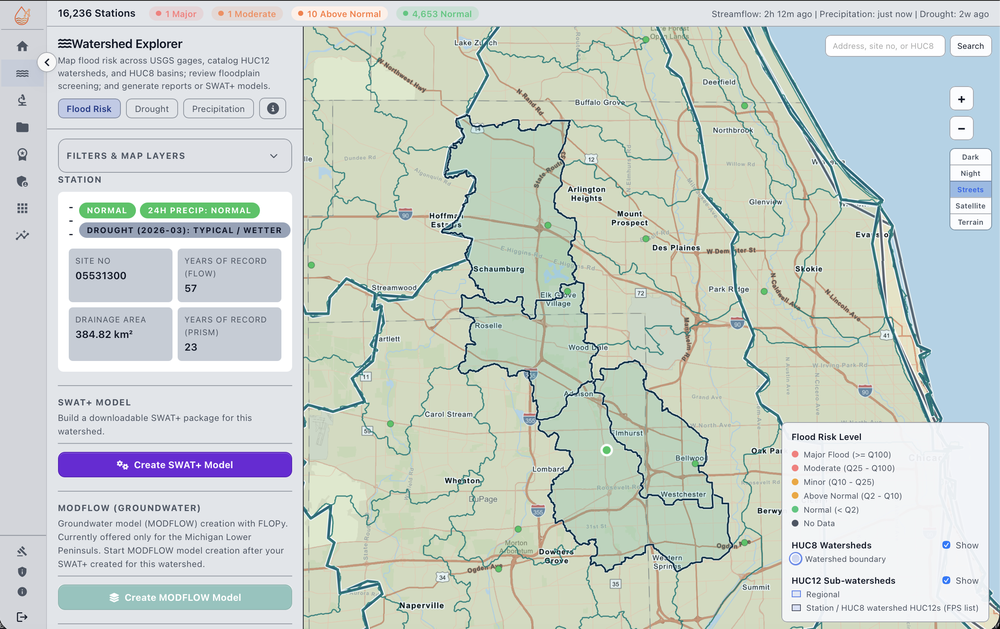
| HUC12 (subwatershed) | Twelve-digit WBD subwatershed (catalog outlet polygon). In Watershed Explorer you pick a HUC12 to define the study-area drainage basin boundary for that outlet. | 87,387 |
| Flowline (NHDPlus HR) | Routed stream reach in the NHDPlus HR NHDFlowline layer—the vector network SWATGenX clips, cleans (divergence/isolated reaches), and converts into SWAT+ channels inside your selected basin. | 24,750,692 (~24.8M) |
| Catchment (NHDPlus HR) | Local drainage polygon tied to the NHDPlus HR stream network (finer than HUC12). SWATGenX uses catchments inside your selected basin to clip soils, land cover, and terrain and to assemble SWAT+ hydrologic response units (HRUs)—the landscape units the model steps over—consistent with NHD routing. | 24,833,258 (~24.8M) |
Workflow in plain terms: you choose the basin at HUC12 (or a USGS gage / whole HUC8 for other entry points). That choice fixes the contributing area. SWATGenX then walks the NHDPlus HR catchments within that area to build subbasin structure and HRUs—the landscape discretization SWAT+ uses for runoff, ET, and land-phase mass balance—before channels and routing are wired from the same hydrography.
Lakes and waterbodies (NHDPlus HR)
NHDPlus HR includes a national waterbody polygon layer (lakes, reservoirs, wetlands, and related features). SWATGenX uses these polygons to represent lakes/reservoirs in the SWAT+ package where they intersect the selected basin and connect to the routed stream network.
| Feature class | What it means (NHD) | CONUS count (this prep) |
|---|---|---|
| Waterbodies (all) | All NHD waterbody polygons in the prepared VPUID set (includes lakes/ponds, reservoirs, wetlands, etc.). | 6,961,480 |
| Lakes / ponds | NHD FType 390 (Lake/Pond). | 5,737,352 |
| Reservoirs | NHD FType 436 (Reservoir). | 298,984 |
| Swamp / marsh | NHD FType 466 (Swamp/Marsh). | 899,050 |
Counts above are for the national prepared dataset; any single model job uses only the subset that falls inside (and connects within) your selected drainage basin.
Four steps, one view
1. Select a watershed — Choose a USGS gage, catalog HUC12 outlet, or HUC8 basin; review the boundary and stream context before continuing.
2. Confirm creation settings — Lock in delineation inputs, optional analyses, and packaging choices aligned with how SWATGenX prepares NHDPlus-HR–backed projects (see NHDPlus HR for SWAT+).
3. Track model creation — Watch the job through the queue until outputs are ready; typical timing varies with basin size and complexity (Example models).
4. Download or calibrate — Pull the SWAT+ workspace for local runs in SWAT+ Editor, or enable Pro workflows described on Calibration methods.
Same framed layout as the home page workflow carousel: use arrows or dots to change slides; the deck advances automatically unless you pause on hover. Click the image for a full-size view.
Maps, reports, and packages
Screening (flood status, rainfall class, floodplain-style zones, exposure overlays) and PDF reports summarize the selected basin in the app. The SWAT+ package is the downloadable QGIS project, Editor database, climate and streamflow series, and documentation assembled from the same national pipeline—details in Methodology and SWAT+ model generation.
Optional cloud calibration and multi-year reporting are configured in-app; scope and metrics are summarized on Calibration methods.
What runs automatically vs. what you control
SWATGenX runs national clip-and-resample, HRU and channel build, QSWAT+ through SWAT+ Editor, ZIP packaging, and queue placement. Delineation prefers NHDPlus-HR–aligned QSWAT+; if that path cannot satisfy routing, the same rasters continue with TauDEM-based QSWAT+ delineation. Raster prep uses your preferred watershed DEM and, on failure, retries once with a 30 m watershed DEM before the next delineation option.
Below is what you choose in the app or API. Numbers are validated and clamped to safe ranges; full definitions live on Methodology, Calibration methods, and the Developer API.
| Topic | What you set |
|---|---|
| Model build | Which basin (USGS site_no, catalog outlet_huc12, or huc8_code when offered). Grid spacing: ls_resolution (land use / soil) and dem_resolution (preferred watershed DEM)—same fields as the workspace Create SWAT+ flow and API examples. |
| Calibration search | Separate calibration and validation calendar-year bands (within 2000–2024), 2–5 warm-up years in each window, PSO pool size, max concurrent evaluations, max iterations, stagnation stop (stall 5–20 iterations), initial warm-up samples (0–60), max init retries per particle (0–3). Use the live form on Calibration & validation. |
| Cost & wall time preview | POST /api/calibration/model-estimate and the in-app estimator: validation-run count, optional fixed selected_server_vcpus, optimize_for as cost or time, and either a fixed server shape or Auto. Response includes RAM per SWAT+ run, RAM at your parallelism, and a server comparison grid (vCPUs, RAM, wall hours, indicative infrastructure prices). Usage attribution follows actual runtime on the machine you use, with a minimum counted wall-time floor for accounting. |
After you download a package, edits in SWAT+ Editor or other tools are entirely under your control—we do not own your model files.
Behind the scenes (advanced)
Executable models and pipeline
Generation time depends on basin size, channel density, delineation source, and queue state. Pro adds optional cloud calibration and validation. SWATGenX uses QSWAT+ and SWAT+ Editor in the automated chain; it complements those tools rather than replacing them. For layer tables, climate resampling notes, and assembly QA, see Methodology.
Data & automation (summary)
NHDPlus HR networks, PRISM / NSRDB climate, NLCD, gSSURGO, and DEM derivatives feed HRU build and routing prep. The full narrative lives under Methodology; this section is only a pointer for due diligence readers.
System architecture
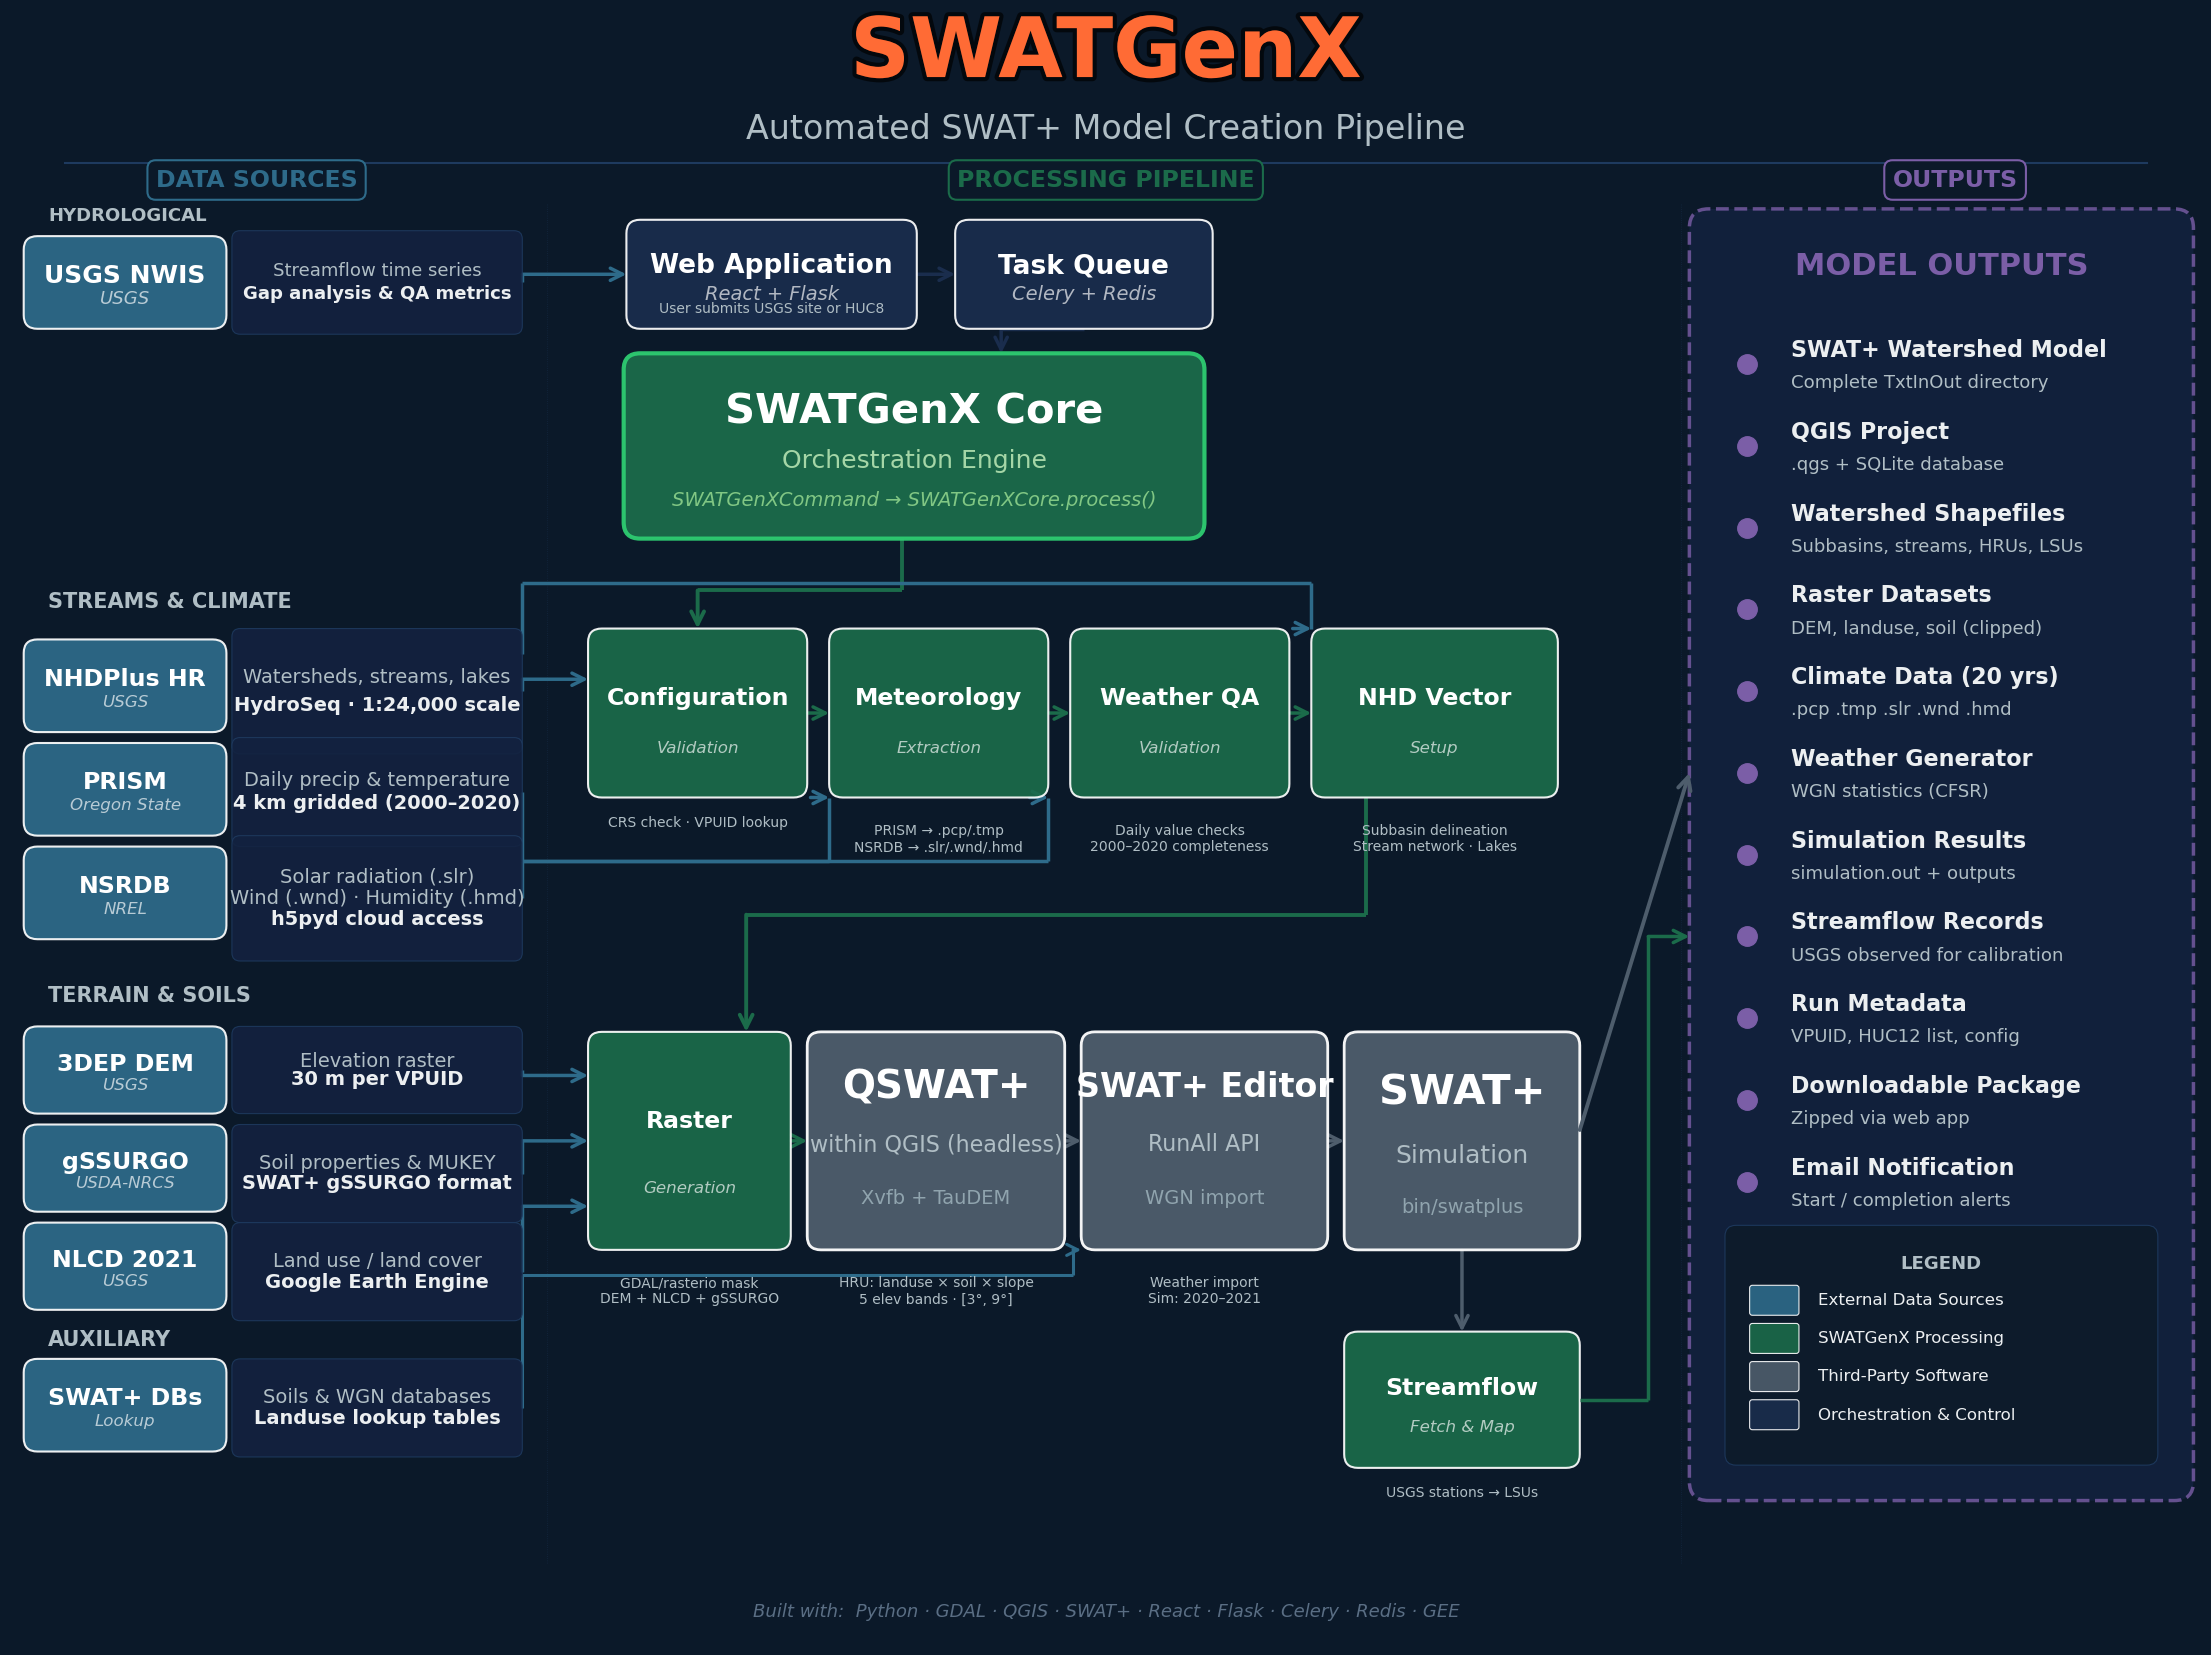
SWATGenX architecture: national datasets → data processing → model generation → results and reports
Model generation benchmark
SWATGenX reported transparent wall-clock processing times for three inventory-locked HUC12 showcase domains (Small, Medium, and Large structural tiers) in our publication evaluation protocol. Each row is an instrumented, single-process scripted run that produces a downloadable SWAT+ package on one host—the same three outlets cataloged under Example models.
| Size tier | Showcase domain | HRUs | Channels | Processing time (min) |
|---|---|---|---|---|
| Small | Florida (USGS outlet, HUC12) | 473 | 45 | 9.8 |
| Medium | Pennsylvania (USGS outlet, HUC12) | 9,296 | 520 | 18.7 |
| Large | Kansas (USGS outlet, HUC12) | 36,855 | 2,370 | 49.8 |
Order-of-magnitude transparency for structural discretization burden—not a cross-tool performance claim. Times exclude optional cloud calibration, browser queue wait, and first-time national data downloads on cold storage; your basin and queue state will differ.
Model Creation API examples (Jupyter + Python): GitHub.