SWATGenXSWATGenX
Watershed ExplorerPricing
ServicesWatershed ExplorerExample modelsCloud calibrationDocsPricing

Chesapeake Bay

Lower Chesapeake
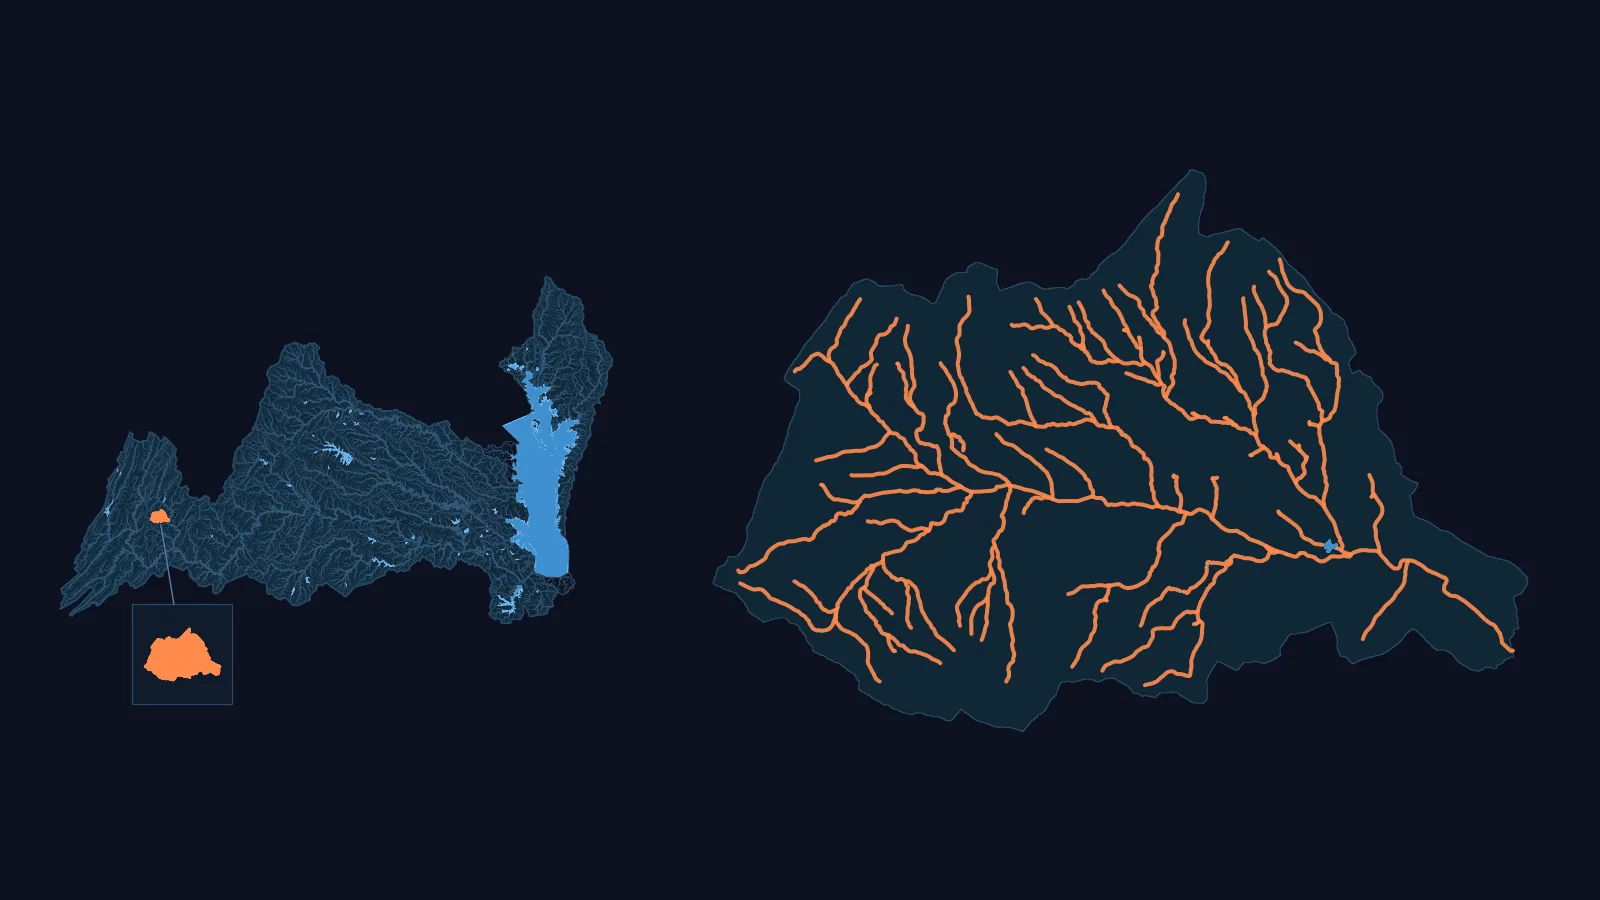
Left: the Lower Chesapeake basin (WBD HUC4 0208) with its NHDPlus HR network, the lower Chesapeake Bay and the basin's larger lakes and reservoirs as water, and our model (USGS 02022500) in orange, enlarged in a box. Right: that model drawn large, every one of its channels, with its water bodies in blue.
Left: the Lower Chesapeake basin, with our model (USGS 02022500) in orange, enlarged in the box, and the lower Bay and the basin's larger lakes and reservoirs in blue. Right: that model drawn large, its channels in orange and its water bodies in blue.
  • 1 published SWAT+ model
  • NHDPlus HR: 81,765 km of network flow paths, 2.08x NHDPlus V2.1's 39,315 km
  • 72 USGS gauges with a 90 % daily record, 2014-2024 (15 of 18 HUC8s covered)
  • 18 HUC8s both datasets carry, 50,522.2 km² (WBD HUC12 sum)

Not in this comparison: HUC8 02080101 (in NHDPlus HR only).

Basin: HUC4 0208 (Lower Chesapeake) of the USGS Watershed Boundary Dataset.

Our models in this basin

Maury · USGS 02022500 (Kerrs Creek near Lexington)

Model outputs

  • Johns Creek at New Castle, VA · USGS 02017500 · gauge drainage area 271.9 km² · Not offered: no channel at the gauge, so no flow chart
  • Kerrs Creek near Lexington, VA · USGS 02022500 · gauge drainage area 90.9 km² · Open the model

NHDPlus HR, not Version 2, in this basin

020,00040,00060,00080,000100,000020,00040,00060,00080,000100,000NHDPlus Version 2.1, kmNHDPlus HR, kmSusquehanna River BasinUpper ChesapeakePotomacLower ChesapeakeLower Chesapeake
Each point is one basin (WBD HUC4): its network flow paths in NHDPlus Version 2.1 (across) and in NHDPlus HR (up), filled with canals and ditches in both counts, hollow without them. On the line, the two would be equal. Ringed: the two datasets' areas for this basin differ by more than 5 %: Upper Chesapeake. In this figure, this basin's points are orange.

National models at this basin's gauges

At the 66 USGS benchmark gauges in this basin: NWM v2.1 median KGE 0.62, NHM median KGE 0.68. This is the national models' published skill at these gauges, not SWATGenX's. Source: Towler et al. 2023 data releases, DOI 10.5066/P9QT1KV7 (NWM v2.1) and 10.5066/P9DKA9KQ (NHM).

A model of your Bay watershed

We build a SWAT+ model for a USGS stream gauge in the Bay's four regions, on NHDPlus HR. You download it as files you open in SWAT+ Editor and run, and you keep the files.