
SWAT+ constituent transport
Water quality modeling for U.S. watersheds
Can you model nitrate, phosphorus, ammonia, and sediment for your basin — and what will you actually get? A SWAT+ package assembled from national data, plus observed loads graded against drinking-water and eutrophication anchors before you commit.
Observed context: USGS WQP 2000–2024 · Simulated constituents: nitrate, phosphorus, ammonia, sediment
What you get — four constituents, real thresholds
SWATGenX does not invent pass/fail bands. Explorer grades each observation against anchors a regulator would recognize — then uses the same breakpoints on the map.
| Constituent | Unit | Anchor cited on the page | Good / moderate / elevated cutoffs (mg/L) |
|---|---|---|---|
| Nitrate | mg/L as N | Drinking-water MCL 10 mg/L as N | 2 / 5 / 10 |
| Total phosphorus | mg/L as P | Eutrophication screening ~0.1 mg/L as P | 0.05 / 0.1 / 0.25 |
| Ammonia | mg/L as N | NH₃-N toxicity screening ~1 mg/L as N | 0.1 / 0.5 / 1.0 |
| Suspended sediment | mg/L SSC | Turbidity / SSC screening bands | 25 / 100 / 250 |
SWAT+ simulates these constituents in the delivered package; the table above describes observed grading only.
Observed loads you can inspect before ordering
4,757 stream stations carry at least one graded concentration from USGS WQP (2000–2024). Toggle the Nutrients lens in Watershed Explorer — markers inherit the same status colors as the station detail panel.
This is screening context, not a calibrated load estimate and not part of the downloaded model ZIP. Use it to see whether your basin already shows elevated nitrate or phosphorus before you spend build quota.
Open Explorer — Nutrients viewStation count: 4,757 stations with data, counted on 2026-08-22 from the Water Quality Portal's EPA STORET records.
How a water-quality setup is produced here
The hosted workflow stops at a defensible SWAT+ package. Calibration, BMP design, and regulatory documentation stay in your toolchain — but the national clip-and-wire step is done.
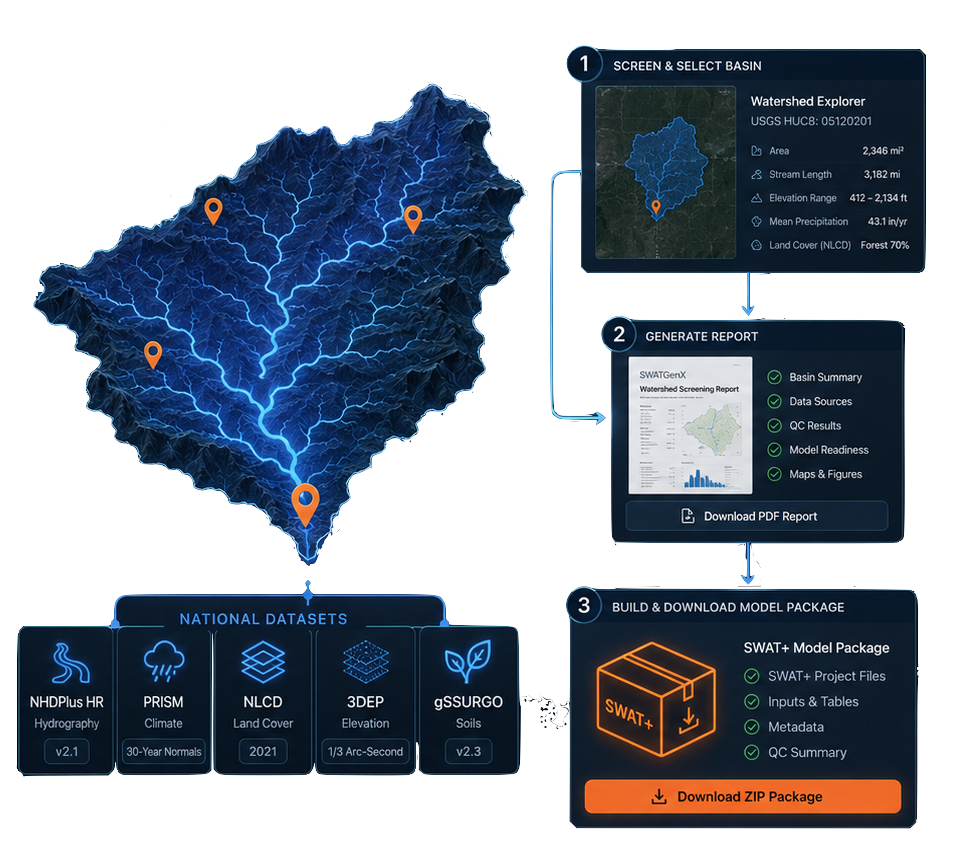
- Screen observed loads in Explorer.
Open the Nutrients lens on ~4,800 USGS/WQP stations (2000–2024). Each marker is graded good / moderate / elevated / high against the same thresholds the map legend uses — not a generic color ramp.
- Order a SWAT+ package at your boundary.
Pick a USGS gauge, HUC12 outlet, or whole HUC8 where enabled. The build wires NHDPlus HR hydrography, gSSURGO soils, NLCD land cover, and PRISM/NSRDB climate into a QSWAT+ / SWAT+ Editor project with constituent routing already present.
- Calibrate and scenario-test offline.
Download the ZIP, run SWAT+ locally or on HPC, and calibrate flow first then nutrients in Editor or your toolchain. BMP and land-management scenarios are evaluated in SWAT+, not in the hosted UI.
PFAS transport is research work, not part of the standard nutrient package described here: see the SWAT+ and MODFLOW 6 page and the Wurtsmith PFAS study under Research.
What is calibrated on this platform — and what is not
Streamflow performance for showcase models is published with NSE/PBIAS-style metrics. Water-quality constituents are simulated in SWAT+ but not calibration-verified here.
As of 2026-08-22, swat_showcase_model holds 127 rows and zero water-quality metric columns (verified by PRAGMA table_info). You may claim observed WQ screening plus SWAT+ constituent simulation; do not claim validated nutrient predictions or sign-off-ready load estimates from SWATGenX alone.
Flow calibration and held-out validation are documented on Calibration & validation for eligible models. Nutrient calibration — typically flow first, loads second — remains offline in SWAT+ Editor.
For Texas TMDL and watershed protection plan work, see modeling for a Texas watershed protection plan.
SWATGenX is not a receiving-water hydraulics or in-lake eutrophication model. Pair watershed source loading with the right downstream tool when your question is in-channel or in-reservoir.
Common questions
Which water-quality constituents does SWAT+ simulate here?
The platform surfaces four variables with observed context in Explorer: nitrate, total phosphorus, ammonia, and suspended sediment. They are the same four keys in flood_analysis.WATER_QUALITY_VARIABLES and the Nutrients map overlay.
What observed data can I see before ordering a model?
USGS Water Quality Portal results from 2000–2024, ingested into water_quality_current and mapped in Watershed Explorer under the Nutrients view. As of 2026-08-22 that is 4,757 stations with at least one graded concentration — screening context only, not bundled into the model ZIP.
Can I calibrate nutrients to my own observations on SWATGenX?
Streamflow calibration and validation run on every plan, on cloud compute paid from calibration credit. There are no published nutrient NSE/PBIAS metrics in swat_showcase_model (127 rows, zero water-quality metric columns as of 2026-08-22). Nutrient calibration remains your work in SWAT+ Editor after download.
What does a water-quality model order cost?
Model orders follow the same account and subscription limits as hydrology builds — see /pricing for what each plan includes (Free, Starter, MAX, Department). Explorer screening of observed nutrients is available without ordering.