 SWATGenX
25,335 USGS stations · 87,387 HUC12s · 2,246 HUC8 · 24.7M NHDPlus HR flowlines
Build SWAT+ models.Calibrate in the cloud.Any U.S. watershed.
Generate downloadable SWAT+ packages — catchments, channel–lake connectivity, HRUs, climate, and USGS streamflow — in minutes, not days. Then calibrate against observed flow on dedicated AWS compute that shuts down when results land.
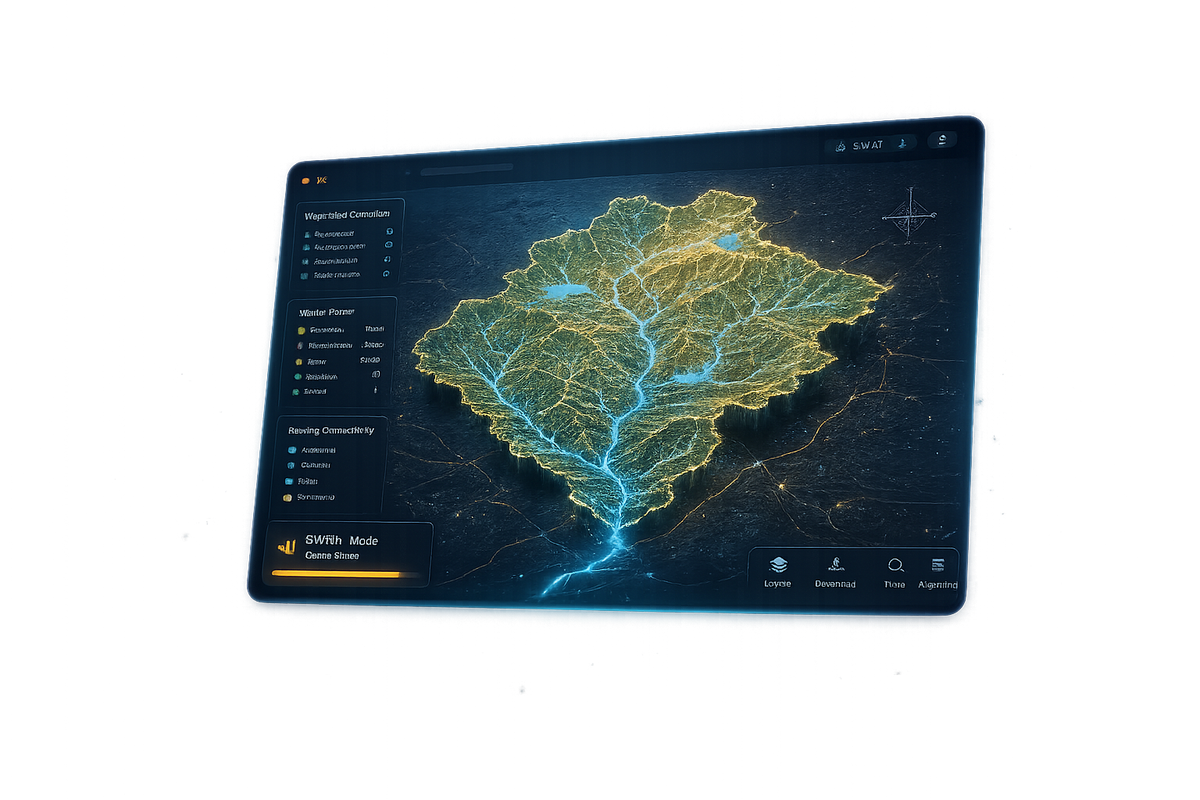
Select watershed → Review datasets → Generate SWAT+ project → Download package → Calibrate & compare streamflow
Browse featured watershed packages built across multiple states and inspect model structure.
What SWATGenX is built for
Watershed modeling breaks down when setup quality varies basin to basin. SWATGenX automates defensible, high-resolution SWAT+ packages at national scale.
- NHDPlus-HR end to end — stream networks, catchments, and routing from outlet HUC12 watersheds through full HUC8 basins (methodology).
- Same pipeline everywhere — HRUs, weather, land cover, soils, crops, and water use assembled consistently for each order.
- Review in the cloud — inspect structure, calibrate, and download a SWAT+ Editor–ready project folder.
What SWATGenX delivers
A downloadable SWAT+ watershed package for your selected USGS gage, HUC12 outlet, or HUC8 basin—not just maps or reports. See Platform Architecture for the full stack.
- SWAT+ project folder — subbasins, channels, HRUs, climate, land use, soils, and management inputs.
- National dataset assembly — hydrography, terrain, weather, NLCD, gSSURGO, crops, and water use in one workflow.
- One workflow, many scales — gage watersheds, catalog HUC12 outlets, and whole HUC8 basins.
- Optional context — PDF reports and screening layers; the core product remains the model package.
Featured SWAT+ models
Review completed packages before you generate your own—watershed size, stream density, delineation source, and download options in the public catalog.
Browse featured SWAT+ models in the catalog, or explore state showcase packages.
Backed by peer-reviewed research
SWATGenX is a research platform, not just a model generator. The same pipeline powers national environmental datasets and coupled modeling studies under peer review—each reproducible from public data and browsable on this site.
How model generation works
- Select a watershed — USGS gage, HUC12 outlet, or HUC8 basin in the Watershed Explorer.
- Generate the SWAT+ package — national datasets assembled into a project structure.
- Download and continue — SWAT+ Editor, calibration, or your own post-processing.
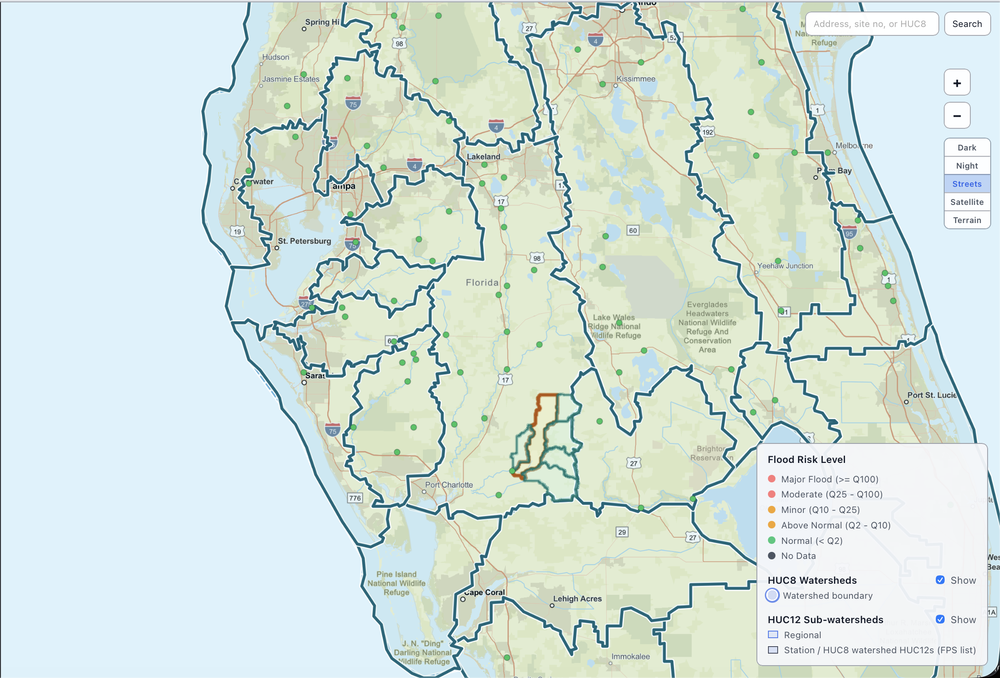
Watershed Explorer in action — browse USGS gages, HUC8/HUC12 boundaries, and basin context before you submit a model job. Use arrows or dots to step through; click any slide for full size.
HUC nesting and dataset details: How it works.
Calibrate and validate in the cloud
Model generation is half the job. SWATGenX also runs PSO streamflow calibration and holdout validation on AWS EC2, so a generated package comes back tuned against USGS observations — not just assembled.
- Dedicated per-job compute — each calibration launches its own EC2 spot instance (32 vCPUs and up) and auto-terminates the moment results are fetched. No shared queue, no idle billing.
- Parallel particle-swarm search — the swarm evaluates SWAT+ runs across all cores while live progress and hydrographs stream to your dashboard.
- Validation included — holdout-period verification with ensemble diagnostics (NSE, KGE, PBIAS) alongside the calibrated parameters.
Cloud calibration is in preview — enabled for Pro accounts on request. Cost and wall-time figures on the AWS page are measured references, not quotes.
Transparent data-to-package workflow
SWATGenX turns national public datasets into a complete, downloadable SWAT+ project—NHDPlus-HR for surface-water structure, then consistent climate, land cover, soils, and management inputs for every order.
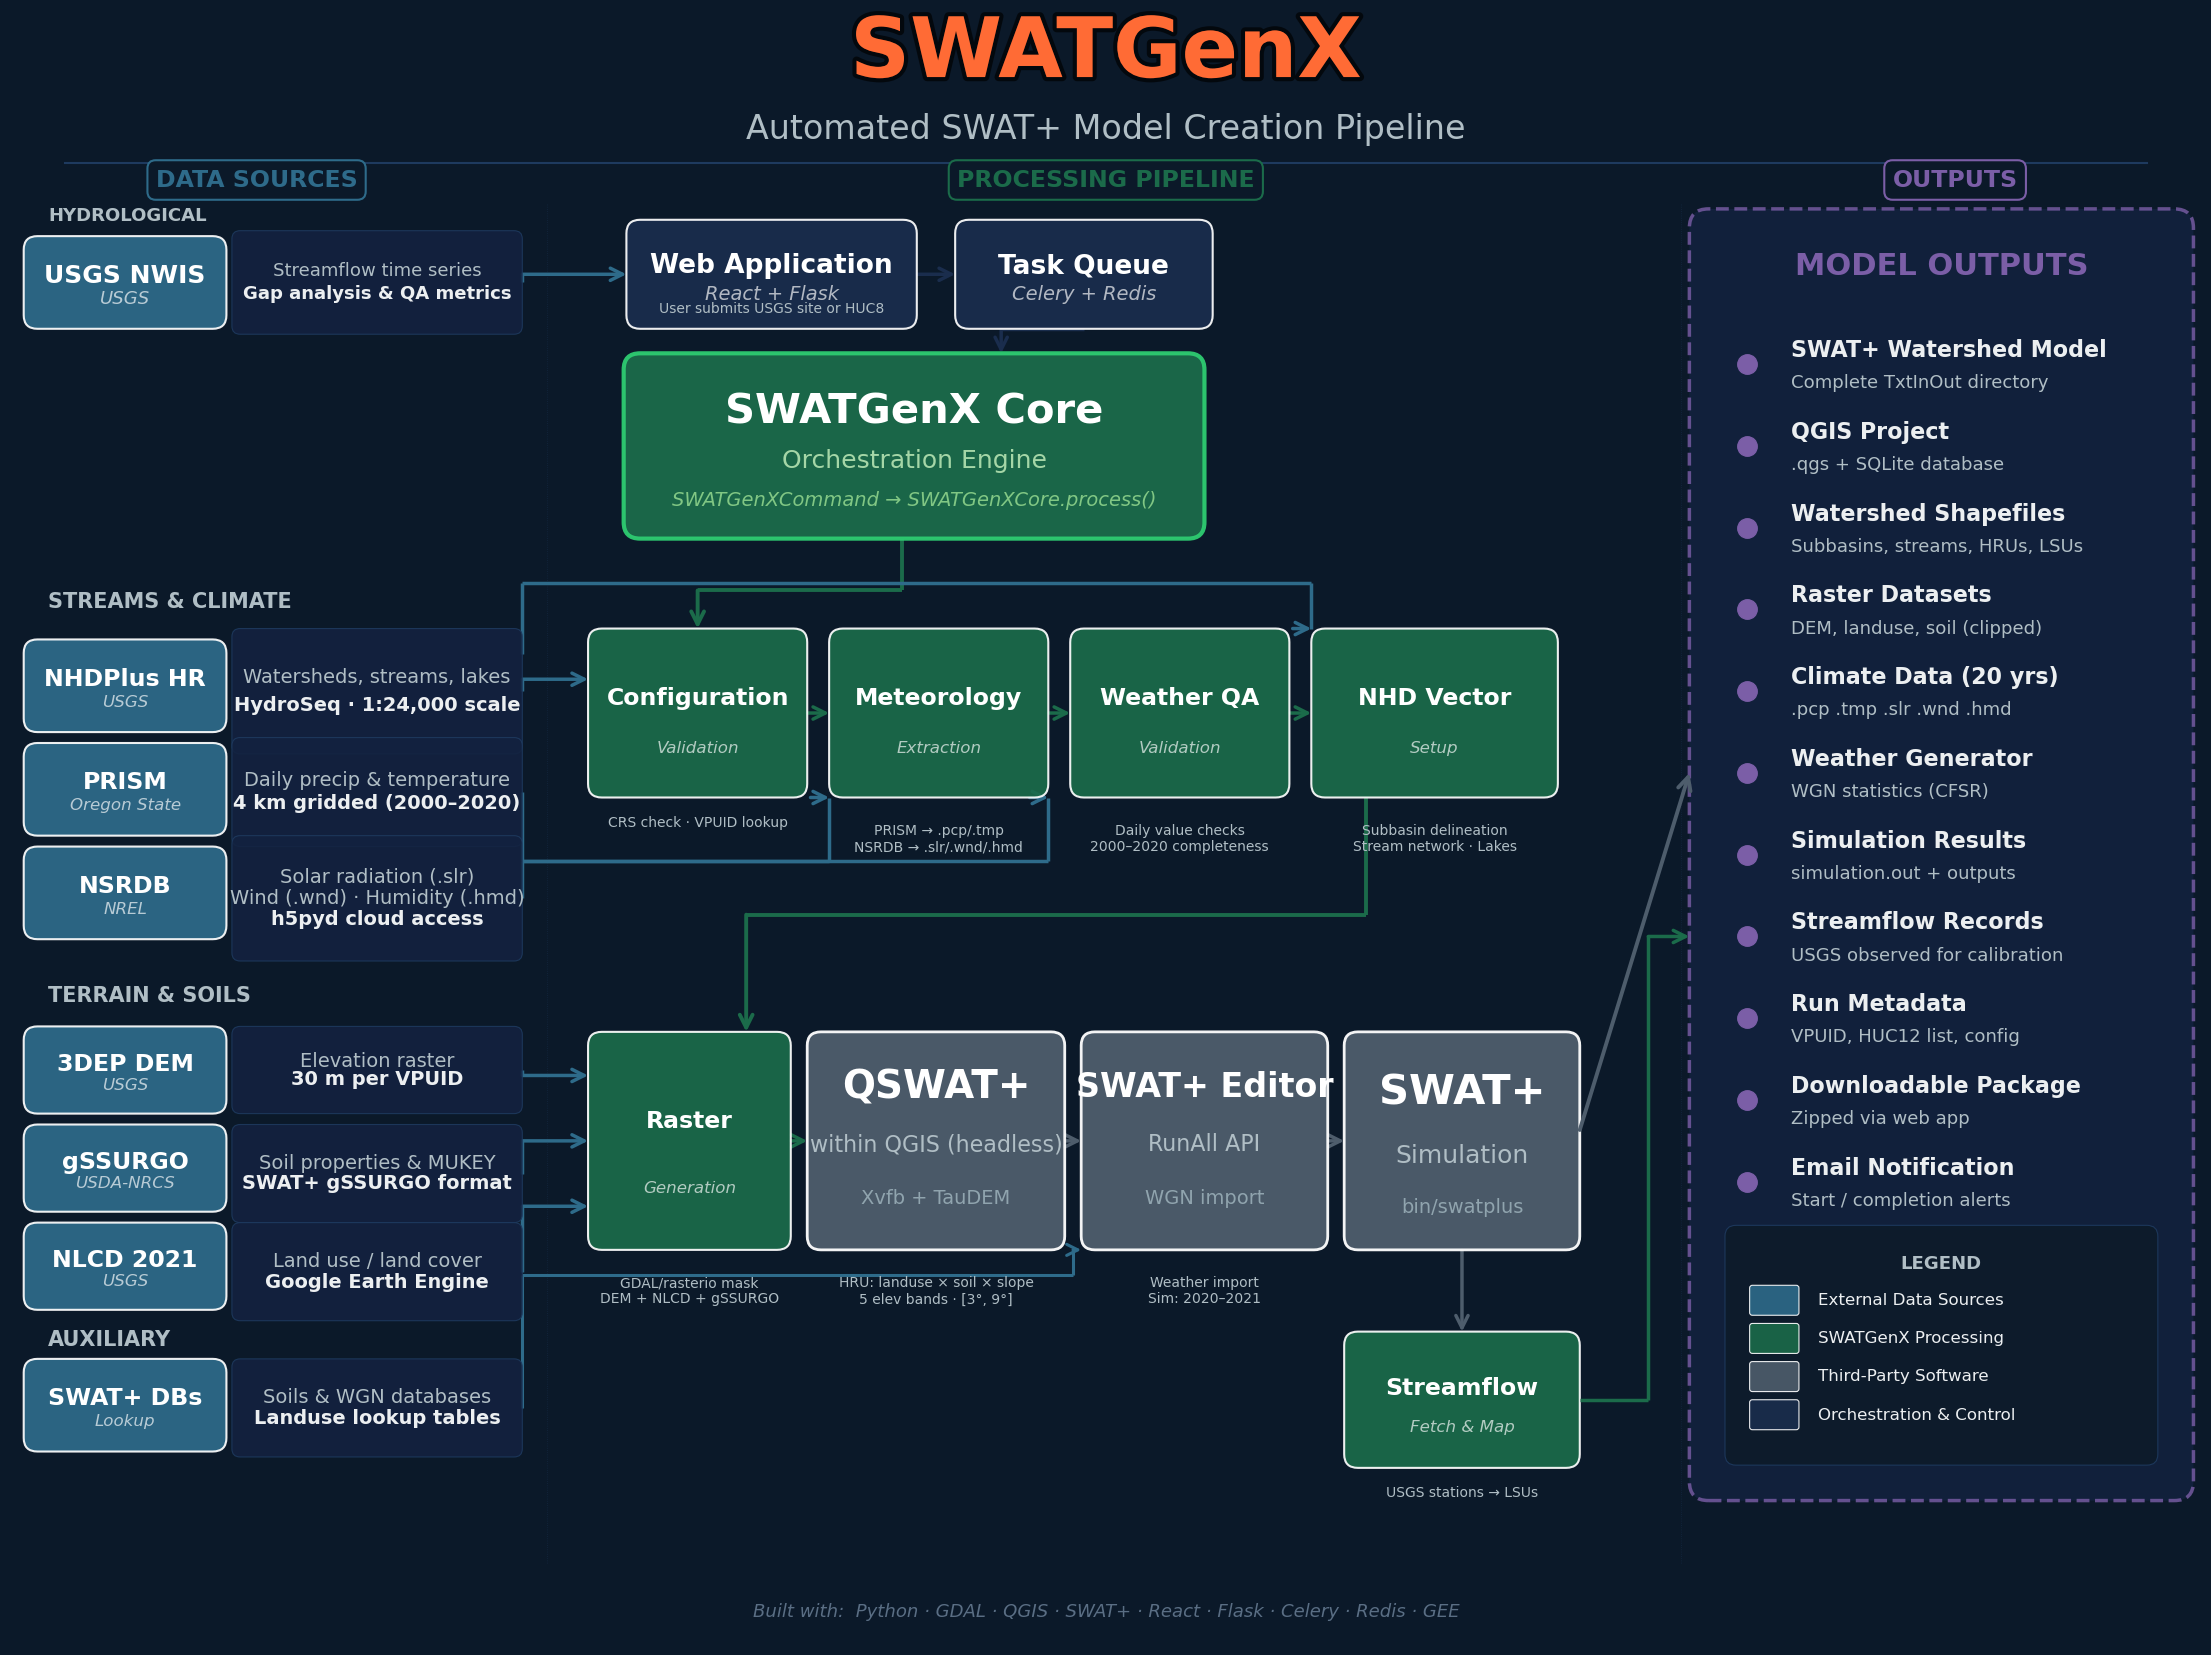
From national datasets to SWAT+ package — click for full size.
Resolution and processing notes: Data & methodology.
- USGS — streamflow records for watershed context and calibration support
- NHDPlus-HR — stream network, catchments, routing, and watershed delineation framework
- PRISM & NSRDB — weather and radiation inputs, including precipitation, temperature, solar radiation, humidity, and wind
- NLCD — land cover inputs for watershed characterization and model setup
- gSSURGO — soil physical properties used in SWAT+ model preparation
- NASS QuickStats — crop rotation and agricultural management inputs
- USGS Water Use — irrigation and water-use inputs where available
Supporting reports and screening outputs
SWATGenX can also generate PDF watershed reports and screening layers to support early review of a selected basin. These outputs help document hydrologic conditions, streamflow-screening context, population exposure, cropland, and stream-network characteristics.
Reports are generated on demand and delivered when ready. Use the sample preview below to review the report structure, tables, and figures. For the end-to-end workspace flow (selection through download and optional calibration), see How it works.
What you may see in a report
Access at a glance
Access works like a research facility: open data for everyone, free accounts for model generation, and extended allocations on request. Tuning concepts are outlined in hydrology calibration methods.
Research account
- Generate gage and HUC12 SWAT+ model packages — free
- Watershed reports and analyses under fair-use allocations
Extended access
- HUC8 whole-basin builds and coupled SWAT+MODFLOW-6 orders
- Calibration allocations and API — by request, free, justified
Explore the platform
Appropriate use
Flood and rainfall indicators on SWATGenX are for rapid triage and planning context, not a substitute for site-specific hydraulic studies, FEMA flood insurance studies, or official emergency warnings. For methodology and citations see Data & methodology. Account rules and data practices are in the Terms of Use and Privacy Policy.
SWAT+ resources
Ready to build a watershed model? Start with your watershed in the Explorer, or review featured SWAT+ models built across states before creating your own package.