Pennsylvania SWAT+ modeling | SWATGenX
Lower Susquehanna-Swatara — USGS 02050305: documented SWAT+ USGS station watershed snapshot with Explorer-aligned maps.
Pennsylvania model packages · All states · Watershed Explorer
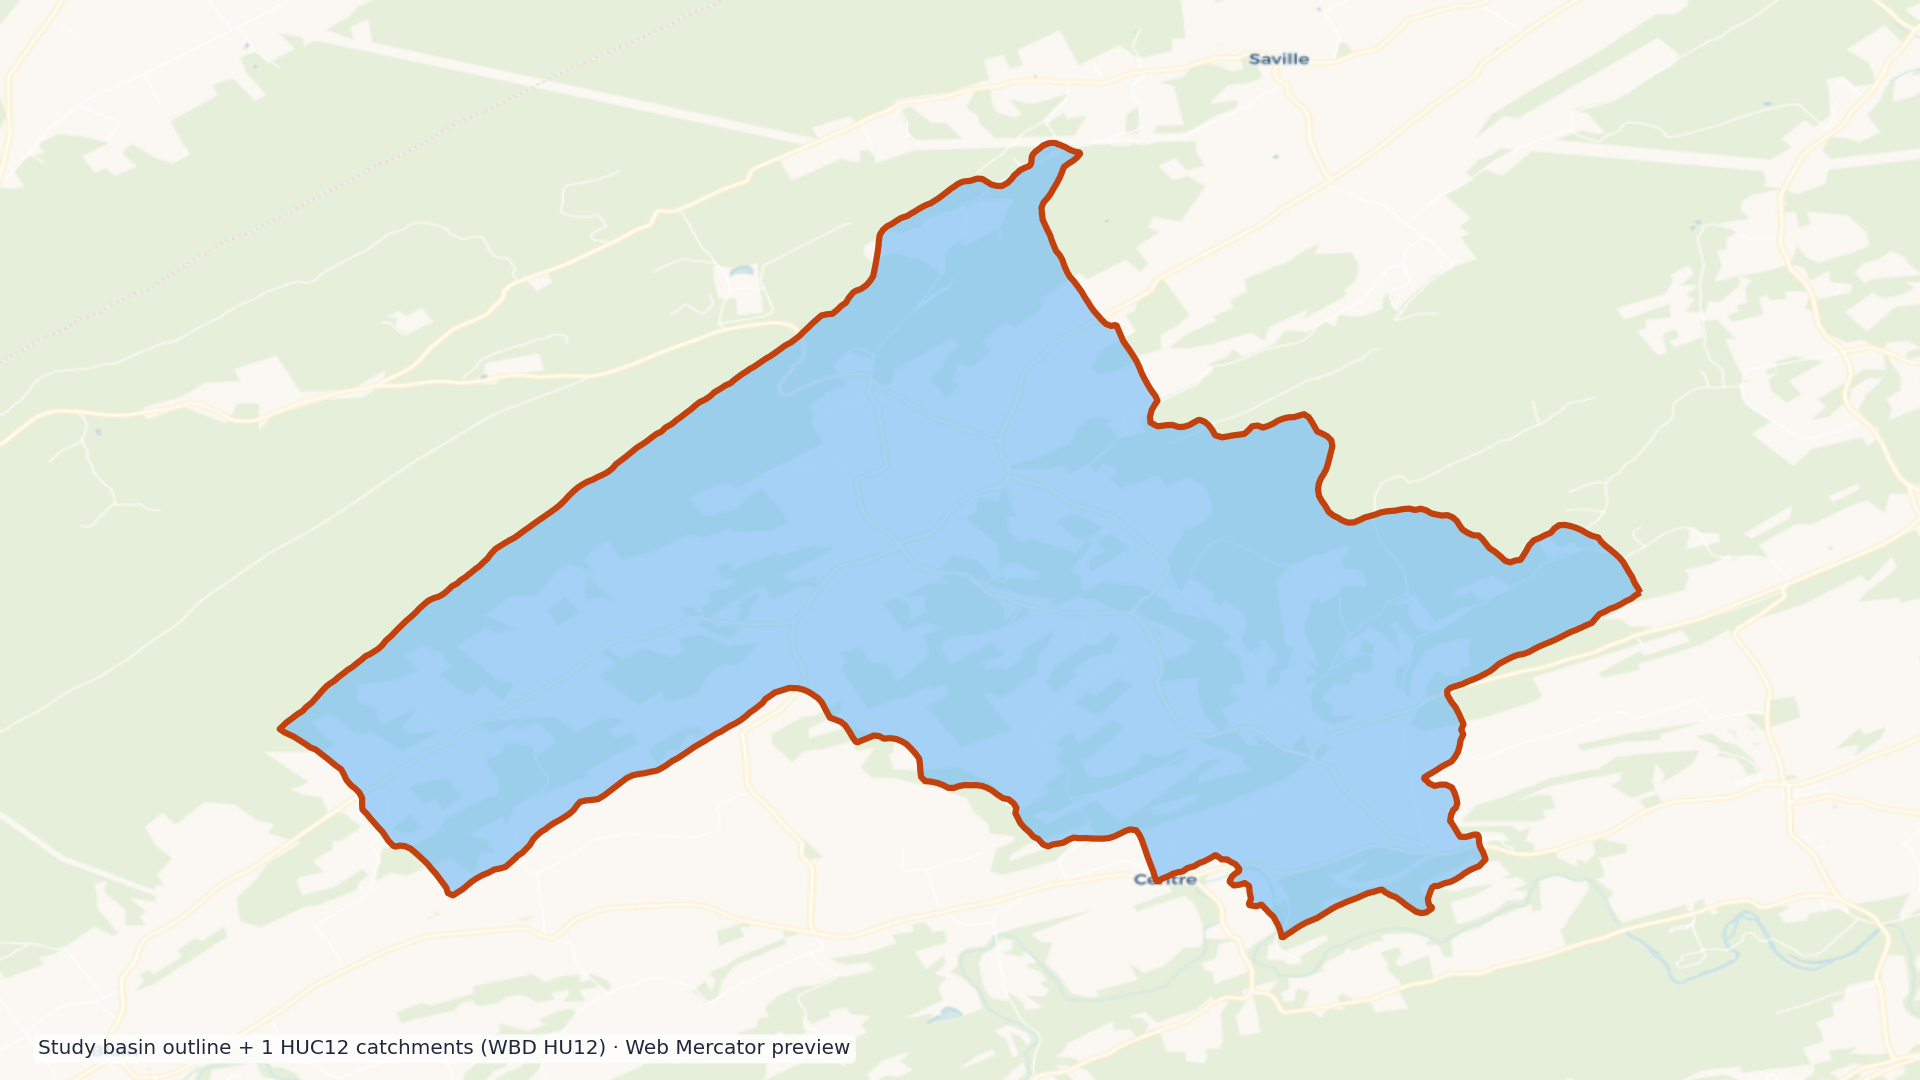
Case study basin: Lower Susquehanna-Swatara
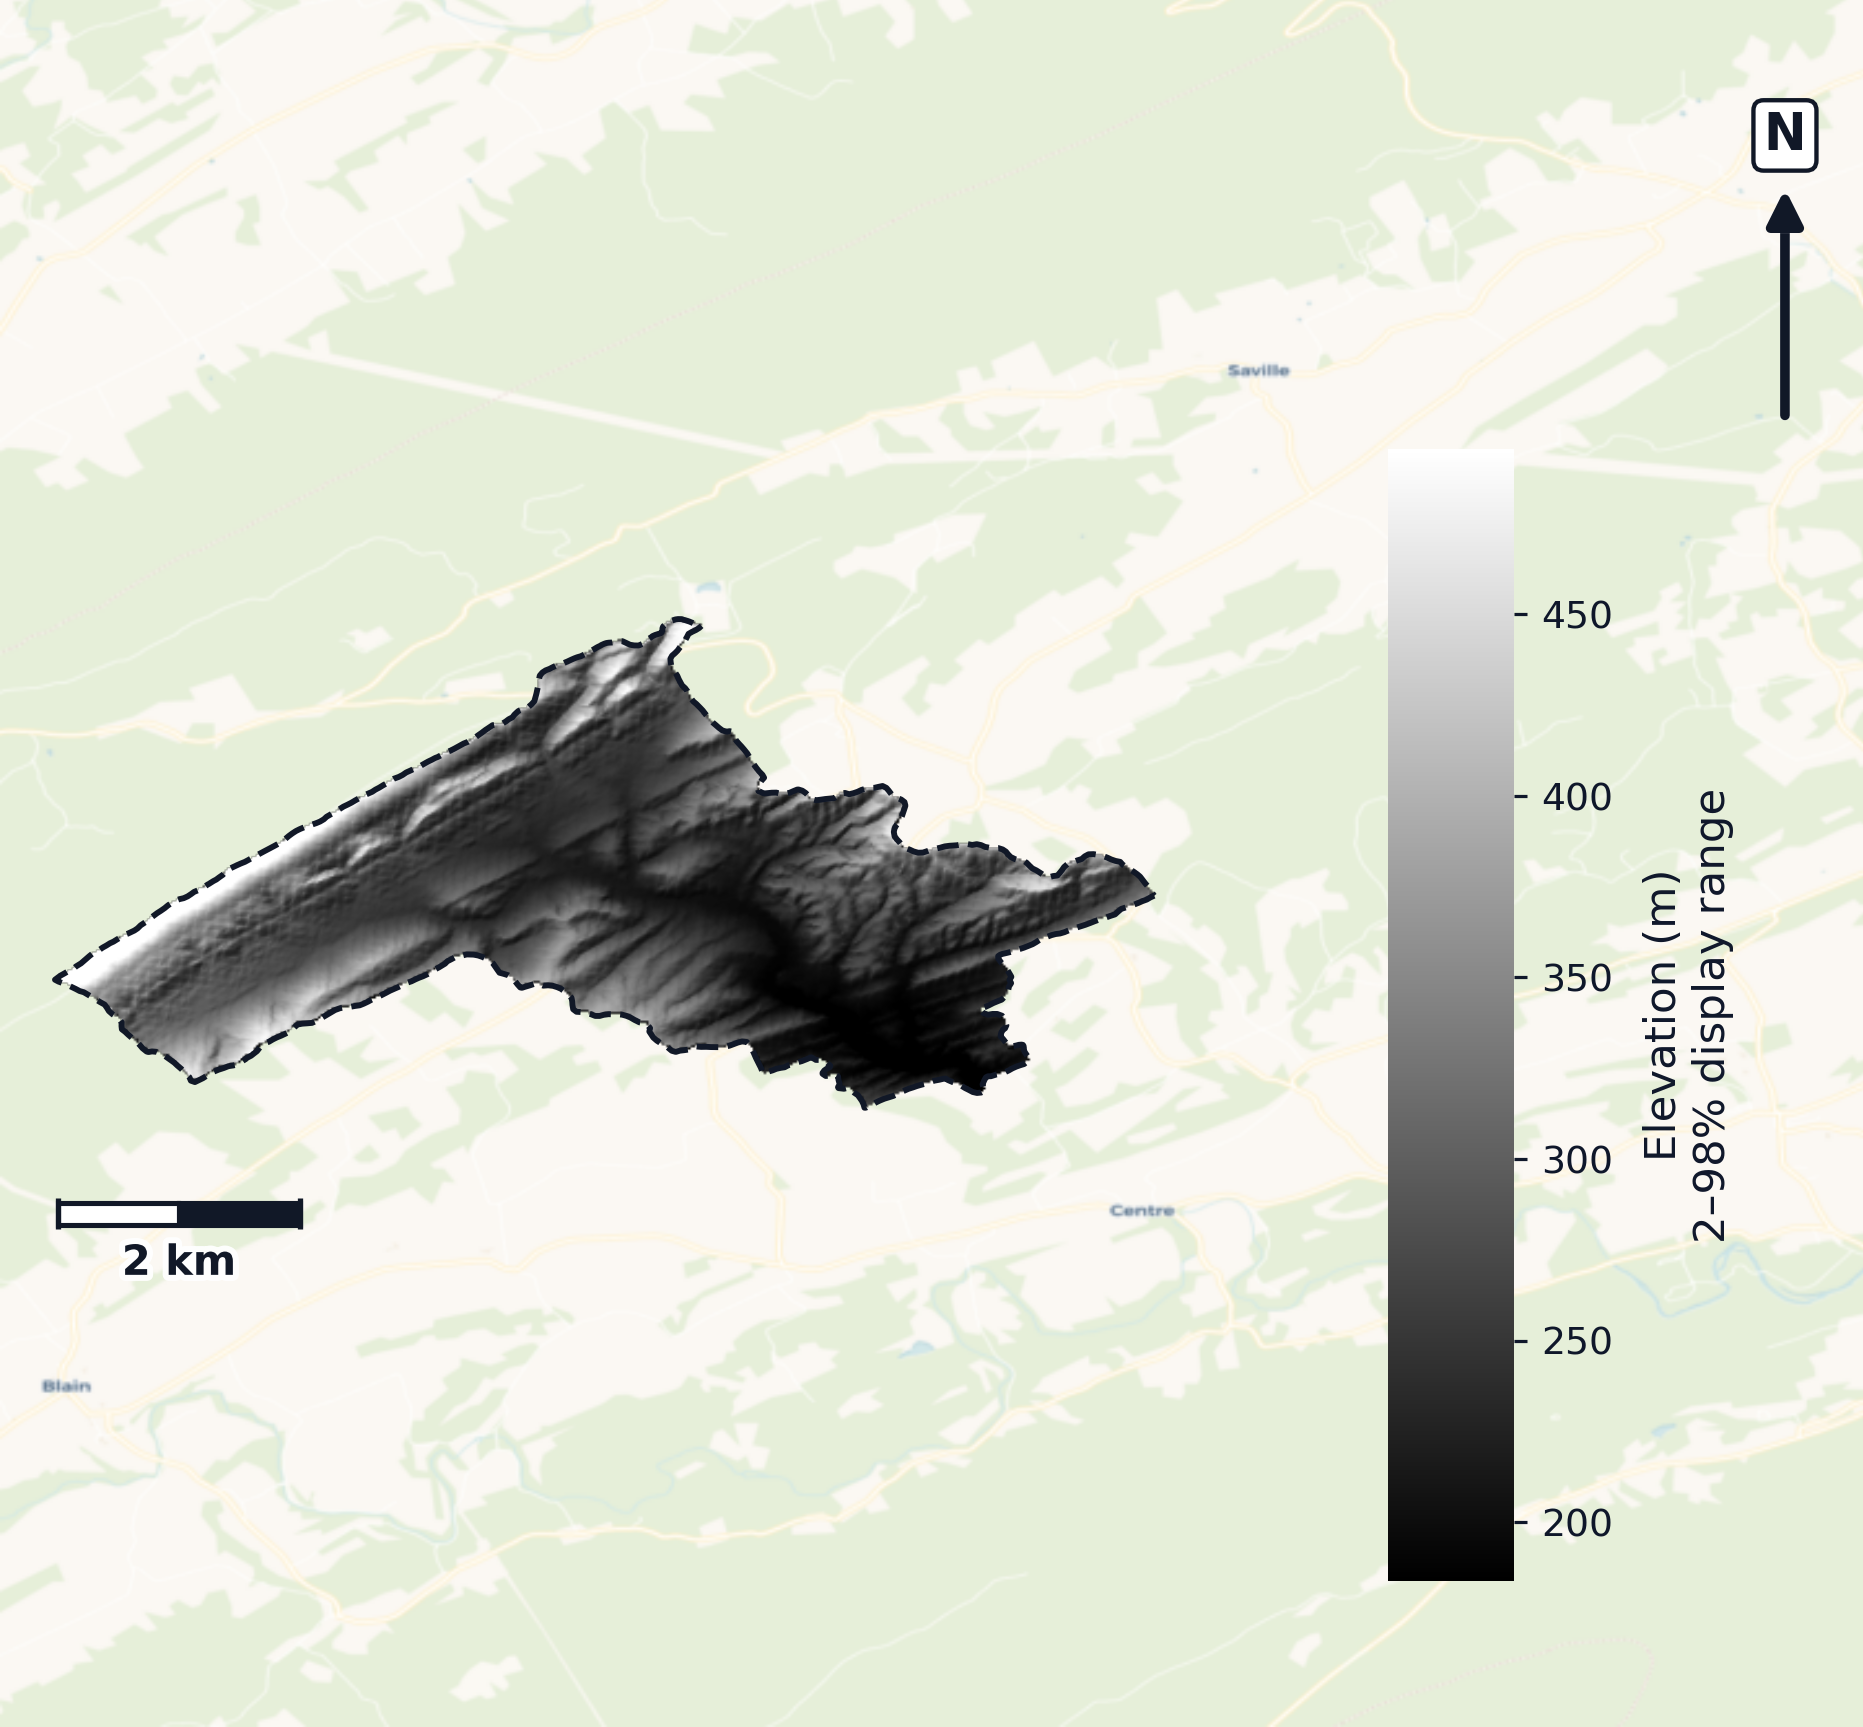
Below is a documented SWAT+ model-build snapshot for the Lower Susquehanna-Swatara watershed—the same export class as Watershed Explorer. The metric strip, maps, charts, NHD flowline-length summary by feature class, and fact tables follow from that committed export.
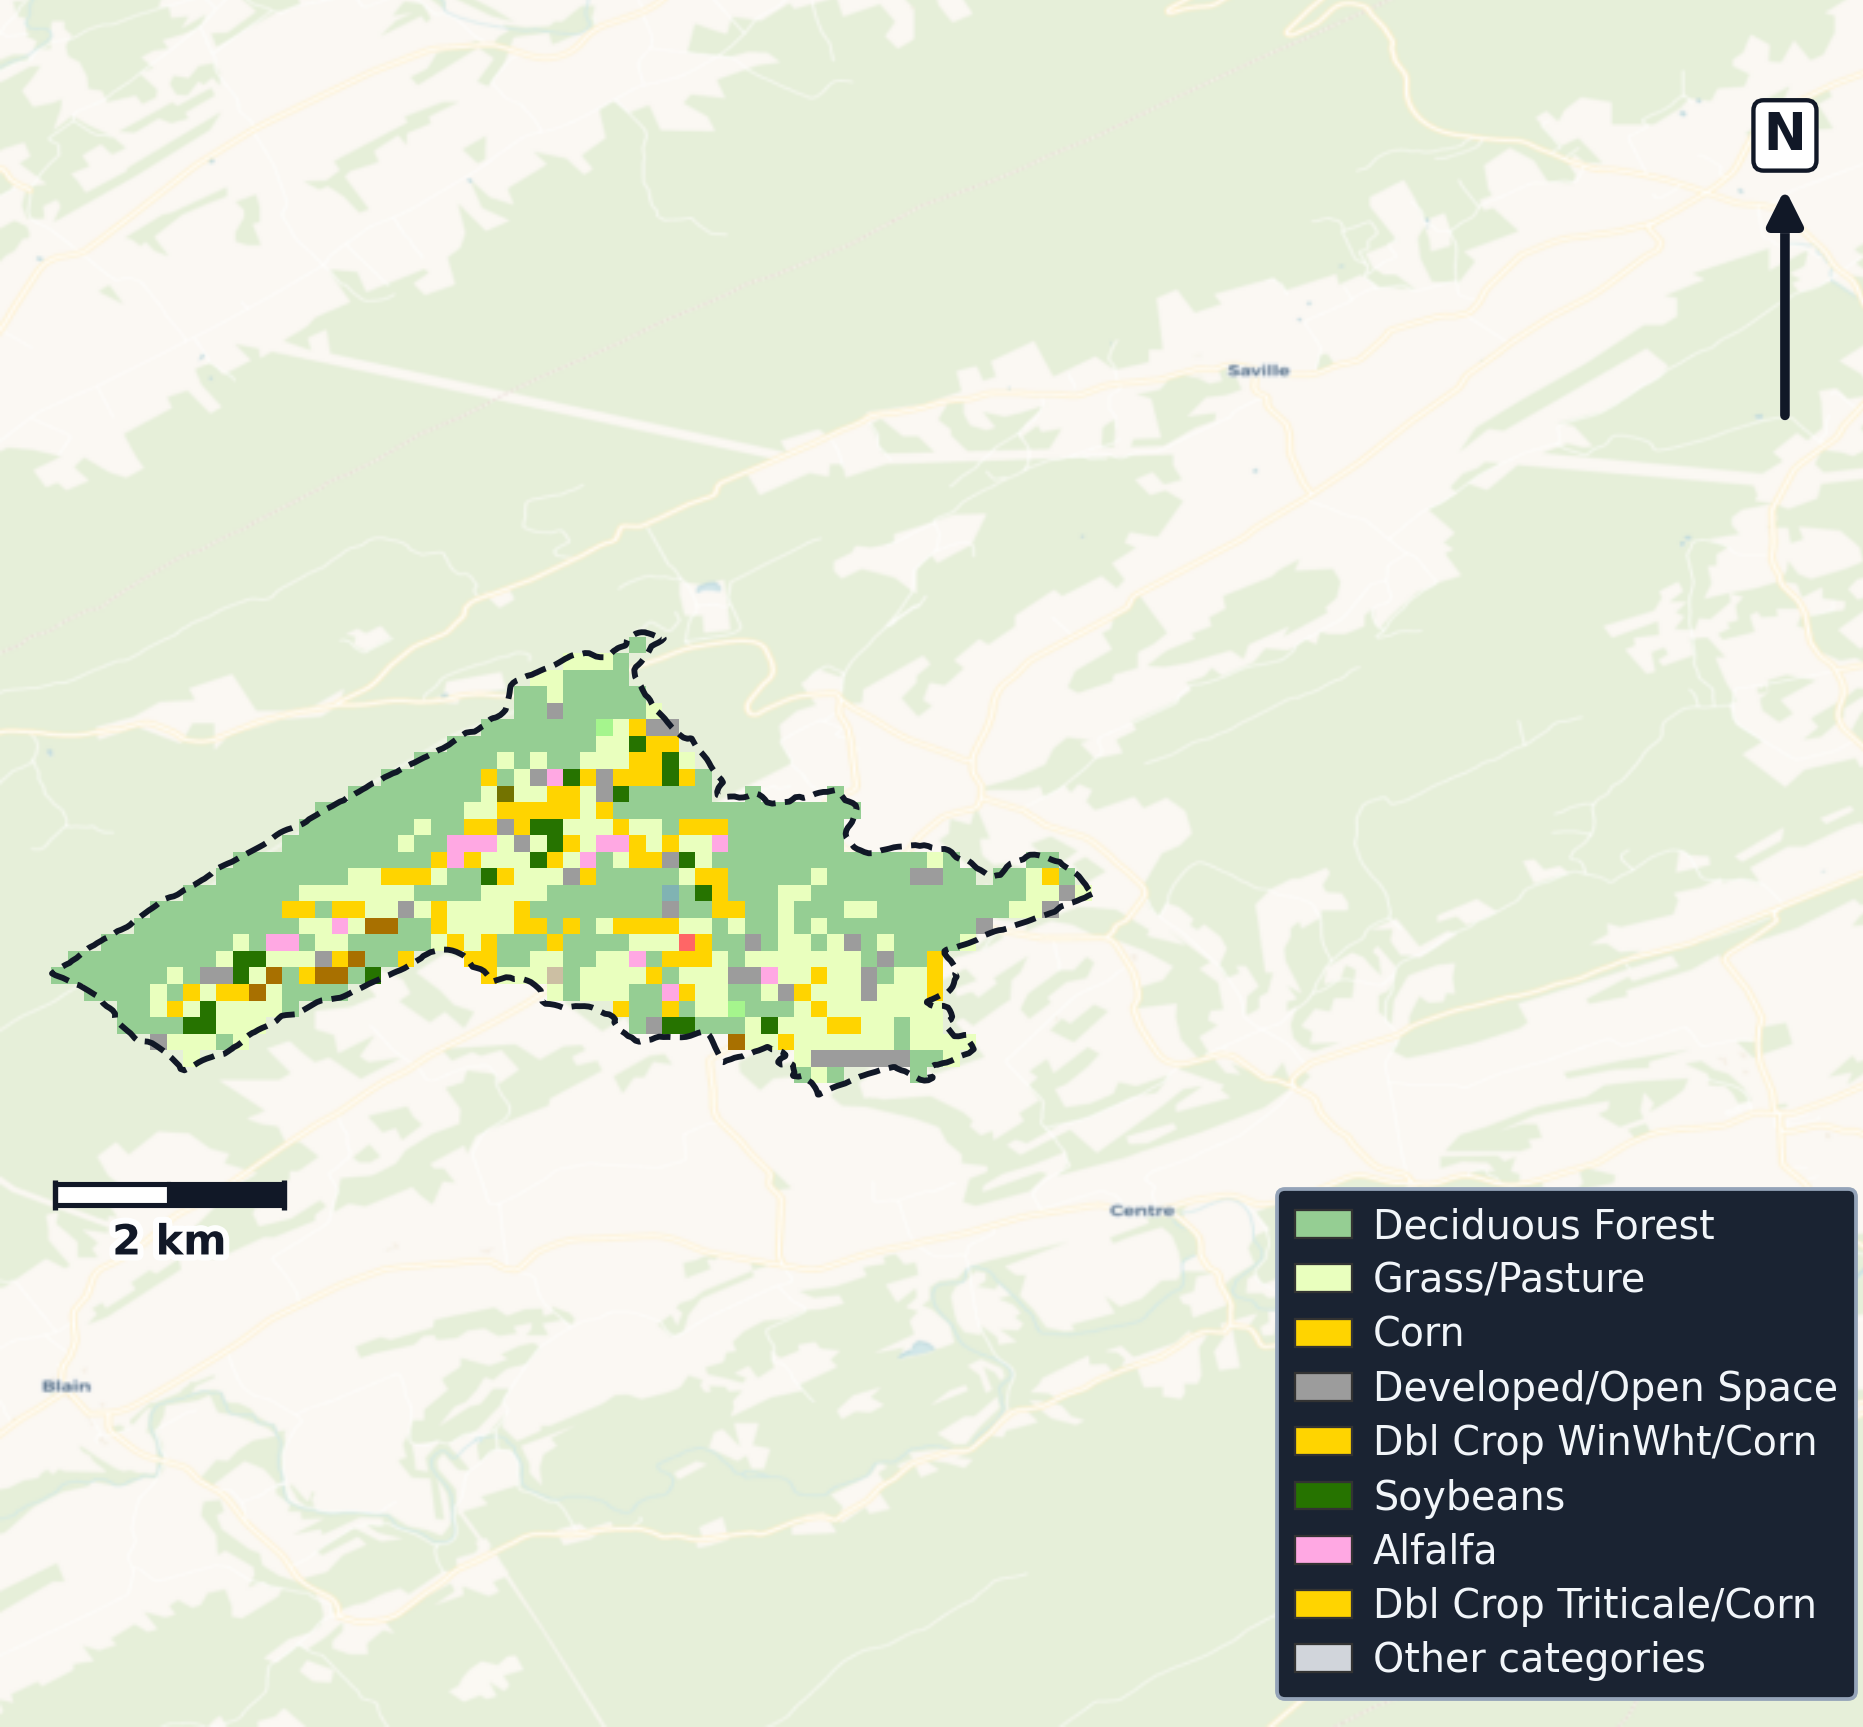
The metric strip, fact tables, and optional DEM/CDL maps describe the exported SWAT+ workspace for Lower Susquehanna-Swatara (HUC8 02050305). NHD-linked stream statistics and PRISM climate headers follow the same conventions as other SWATGenX state sample models across CONUS.
Counties in the basin overlay: Perry.
- Runoff timing and climate variability across multi-year forcing
- Channel routing and NHDPlus HR hydrography linkage
- Land cover and HRU discretization for management screening
- Reproducible SWAT+ package delivery via SWATGenX
Basin distributions (Lower Susquehanna-Swatara · Pennsylvania)
CDL charts use the same basin-clipped raster summary as Explorer watershed reports. County population bars use US Census county-or-equivalent polygons only (not state, city, or township layers): one published headcount per county that intersects the basin, then summed for screening—not watershed-apportioned density.
CDL land cover (basin clip)
CDL cropland & permanent crops (share)
Population by county (overlay)
Land-cover mix (km², CDL clip)
Climate forcing (Lower Susquehanna-Swatara · Pennsylvania)
Monthly climatology from basin PRISM precipitation and temperature plus NSRDB humidity, solar radiation, and wind files. The line is the mean daily value for each calendar month (averaged across all station files and years); the shaded band is the P05–P95 spread of those daily values (2000-01-01 – 2024-12-31). Source grid: 15 PRISM/NSRDB grid cells (4 km).
Precipitation
mm day⁻¹ (PRISM)Relative humidity
% (NSRDB)Solar radiation
MJ m⁻² day⁻¹ (NSRDB)Wind speed*
m s⁻¹ (NSRDB MERRA-2, ~2 m)Daily maximum temperature
°C max (PRISM)Daily minimum temperature
°C min (PRISM)* Wind speed. MERRA-2 at ~2 m above ground (not 10 m hub height). Daily arithmetic mean of 48 thirty-minute NSRDB steps; curves are monthly basin means with P5–P95 spread. NREL documents this for solar forcing, not wind-resource assessment.
Key facts
The first table lists basin id, climate window, CDL and population context, and the two published stream-length definitions (channel routing versus NHD-linked stream GIS). The strip above still carries headline structure counts (HRUs, channels, lakes).
| Metric | Value |
|---|---|
| WBD HU8 name | Lower Susquehanna-Swatara |
| USGS site (HUC12 model folder) | 01567500 |
| WBD region (VPUID) | 0205 |
| Watershed area | 51.03 km² |
| SWAT+ stream GIS segments (NHDPlusID → NHDFlowline) | 80 |
| Stream length — channel routing (rivs1, projected) | 67.26 km |
| NHD-linked stream length, GIS projected | 67.26 km |
| DEM resolution (m) | 29.86 |
| CDL cropland (basin clip) | 8.94 km² |
| CDL wetland (Woody + Herbaceous) | 0.06 km² |
| CDL developed | 2.62 km² |
| Population (by county, Explorer overlay) | 45,842 |
| Counties (gov. units) | 1 |
| Climate period (PRISM header) | 2000-01-01 – 2024-12-31 |
| Stats exported (UTC) | 2026-05-23 05:25 UTC |
| SWATGenX snapshot ID | 0205/huc12/01567500 |
| Snapshot label | Lower Susquehanna-Swatara (Pennsylvania) — usgs_station |
| Model statistics generated (UTC) | 2026-05-23T05:25:54Z |
How to read this table: each row starts from Watershed/Shapes/SWAT_plus_streams.shp, where each segment carries NHDPlusID. Those IDs join to NHDFlowline in the USGS NHDPlus HR HU4 geodatabase (VPUID 0205). Lengths add in EPSG:5070 (planimetric km) and roll up by NHD FType / FCode. Row lengths sum to 67.26 km over 80 segments.
| NHD class (label) | Length (km) | Share | Segments |
|---|---|---|---|
| Stream / river (perennial / general)FType 460 · FCode 46006 | 56.39 | 83.8% | 61 |
| Stream / river (intermittent)FType 460 · FCode 46003 | 9.41 | 14% | 10 |
| Artificial path (NHD)FType 558 · FCode 55800 | 0.81 | 1.2% | 7 |
| ConnectorFType 334 · FCode 33400 | 0.65 | 1% | 2 |
The county total matches the bar chart: county-or-equivalent units only (cities and townships excluded), one Census headcount per county intersecting the basin. Screening context only—not basin density or a regulatory design population.
Documented SWATGenX SWAT+ package for Pennsylvania (0205/huc12/01567500). Screening and documentation only—not a regulatory determination.
What SWATGenX generates
SWATGenX assembles national inputs, runs the QSWAT+ / SWAT+ Editor workflow, and exports a reviewable SWAT+ workspace (TxtInOut + GIS + SQLite). Open the package in SWAT+ Editor for scenarios; add calibration and validation with local data where your study requires it.
National datasets (labels)
This sample build uses the same CONUS resolutions as every SWATGenX package—NHDPlus HR at 1:24k, 30 m terrain (from 10 m 3DEP), 250 m NLCD/CDL (from 30 m), 250 m gSSURGO (from 10 m), ~4 km PRISM, and daily NSRDB at PRISM stations (from ~2 km, 30-minute data). See SWAT+ model packages by state for the full stack. Methodology & provenance.
Citations for on-page facts
- Hydrologic catalog: USGS WBD — USGS station 01567500 (HUC12-located SWAT+ model)
- Hydrography: USGS NHDPlus HR — SWAT+ ``SWAT_plus_streams.shp`` ``NHDPlusID`` joined to HU4 ``NHDFlowline`` (FType/FCode); lengths summed in EPSG:5070 for the distribution table.
- Land cover (CDL): USDA NASS Cropland Data Layer (clipped to basin)
- Climate forcing: PRISM Climate Group (OSU), daily met files referenced in weather-sta.cli
- Regional population context: USGS Census county-or-equivalent polygons (GU_CountyOrEquivalent) clipped to the basin — one headcount per county, summed for screening (not basin-apportioned density; cities and townships excluded).
SWAT+ in Pennsylvania — common questions
- How do I run SWAT+ in Pennsylvania? Use SWATGenX to screen basins in Pennsylvania on the Watershed Explorer map, then queue a SWAT+ model build for a USGS gage, catalog HUC12, or HUC8. The platform assembles national datasets into a SWAT+ Editor package without manual QSWAT+ desktop prep for each basin. The sample model on this page is Lower Susquehanna-Swatara (USGS 02050305).
- What is the difference between SWAT and SWAT+ in Pennsylvania? SWAT (legacy) and SWAT+ (current process-based watershed model) both support long-term hydrology and water-quality studies in Pennsylvania. SWATGenX targets SWAT+ and delivers reproducible, high-resolution projects on NHDPlus HR hydrography.
- Can SWATGenX build SWAT+ models for Pennsylvania watersheds? Yes. SWATGenX covers CONUS, including Pennsylvania, with the same national data stack (WBD, NHDPlus HR, PRISM, NLCD, gSSURGO). Each state page documents a sample basin snapshot from a real SWATGenX build; open the live map at https://www.swatgenx.com/watershed-workspace to model your own watershed.
- Is SWAT+ modeling in Pennsylvania free on SWATGenX? Signed-in users can explore Pennsylvania on the map and use tiered quotas for reports and model builds. See https://www.swatgenx.com/pricing for Basic vs Pro limits; Pro adds optional cloud calibration where enabled.
Open Lower Susquehanna-Swatara in Watershed Explorer
Preview uses the USGS WBD boundary with NHDPlus HR context, zoomed to basin extent on a Streets-style basemap. Follow the card into the live workspace (HUC8 02050305).